

ADC
amplitude converter, data analyzer, digitizer, transient recorder, analog-to-digital converter
Analog-to-digital Converters are circuits that quantize a voltage or current into a stream of digital data. Board level products that make ADCs with sample rates of hundreds of Mega samples per Seconds (Msps) or several Giga samples per seconds (Gsps) accessible to the software are often called "digitizers" or "transient recorders". Unlike other ADC boards, our digitizers are optimized to detect pulses on the fly and stream the extracted sample data directly to the main memory, minimizing latency and CPU load. This is enabled by our custom 6GByte/s PCIe DMA controller that manages the buffer data structures directly without software intervention.
You also might like to have a look at the cronologic ADCs Ndigo5G-10 and Ndigo6G-12.
averager
An averager is an ADC digitizer that does not present single acquired waveforms to the user but does calculate the average of multiple waveforms before readout. This greatly reduces the amount of data that needs to be read out. It also takes away flexibility and makes it impossible to do processing on the individual pulses to improve the measurement results. Our Ndigo6G implements zero suppression together with very high readout bandwidth to enable software-based averaging without losing the ability to operate on individual pulses. Contact us to talk about the option of performing hardware averaging in the Ndigo6G.
Avalanche photodiodes
APD, SiPM
Avalanche photodiodes are highly sensitive, fast photodiodes and count among the avalanche diodes, i.e. they are optical sensors based on a silicon substrate. They form the basis for modern silicon photomultipliers (SiPM) and use the internal photoelectric effect to generate charge carriers and the avalanche effect for internal amplification. Similar to conventional photomultiplier tubes (PMT), they use the effects of impact ionization to generate secondary charge carriers. However, they get by with a significantly lower supply voltage and reach limit frequencies of up to the Gigahertz range. Their extremely high sensitivity enables the detection of weak light right down to individual photons. They are therefore also used for the detection of individual particles in high-energy physics. With regard to TCSPC, modern analog SiPM offer the possibility of inferring the photon rate directly from the voltage output. Read also: SPADs and HPDs.
Typical applications for avalanche photodiodes: LIDAR, single-photon counting, and optical TDRs (OTDR).
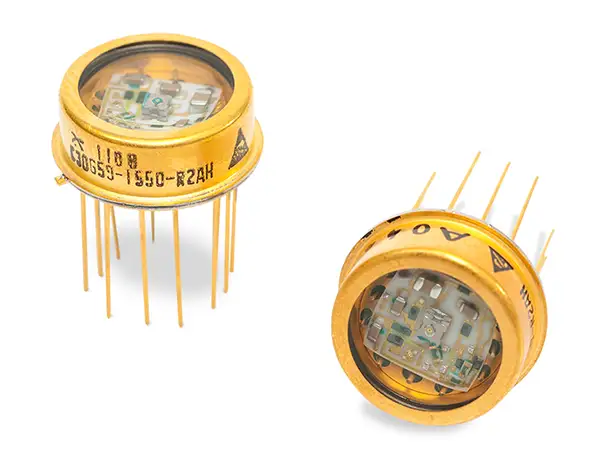
The figure shows an InGaAs APD receiver. This hybrid receiver features an InGaAs avalanche photodiode (InGaAs APD) and a preamplifier. The hybrid concept with an amplifier and photodetector in the same hermetically sealed TO-8 package enables low noise detection and reduces parasitic capacitance. Image by courtesy of Excelitas Technologies.
atomic interferometer
quantum interferometer, atomic wave interferometer, matter-wave interferometer
An atomic interferometer is a highly precise measurement tool that operates on the principles of quantum mechanics. It exploits the wave properties of atoms to enable extremely accurate measurements of physical quantities like acceleration, rotation, gravity, and time.
Due to their high precision and sensitivity atomic interferometers are of great significance in a wide range of scientific and technological fields. They are a prime example of quantum mechanical principles applied in the real world. This makes them particularly interesting and important for scientists and electronics developers, offering a glimpse into the quantum realm's practical applications.
bin size
bin size, jitter, FWHM, RMS, quantization error
A meaningful assessment of the practical resolution of TDCs requires careful inspection of the technical specifications of the devices in use.
In time-to-digital converters, the bin size is the unit of quantization for time measurements, i.e., it describes the digital resolution of the TDC. However, this value alone is not sufficient for evaluating the resolution that can be used in practice. In particular, the time jitter that occurs is of central importance here.
Our high-end TDCs, such as xHPTDC8 and xTDC4 are realized using dedicated ASICs that ensure a controlled and highly uniform bin size. Consequently, residual jitter contributions are substantially smaller than the inherent quantization error. For short time intervals, the measurement uncertainty is therefore predominantly governed by the bin size. Under these conditions, the maximum error approaches approximately half a bin, the root mean square (RMS) error amounts to about 0.8 bins, and the full width at half maximum (FWHM) corresponds to roughly 2 bins.
On the other hand there are TDCs on the market that, unlike chronologic TDCs, are based on an FPGA-implemented carry chain design and therefore have a much higher jitter that is significantly above the digital resolution. In this case, the time jitter is the limiting factor for the usable resolution of the TDC.
For more detailed information on this topic, please also refer to this application note.
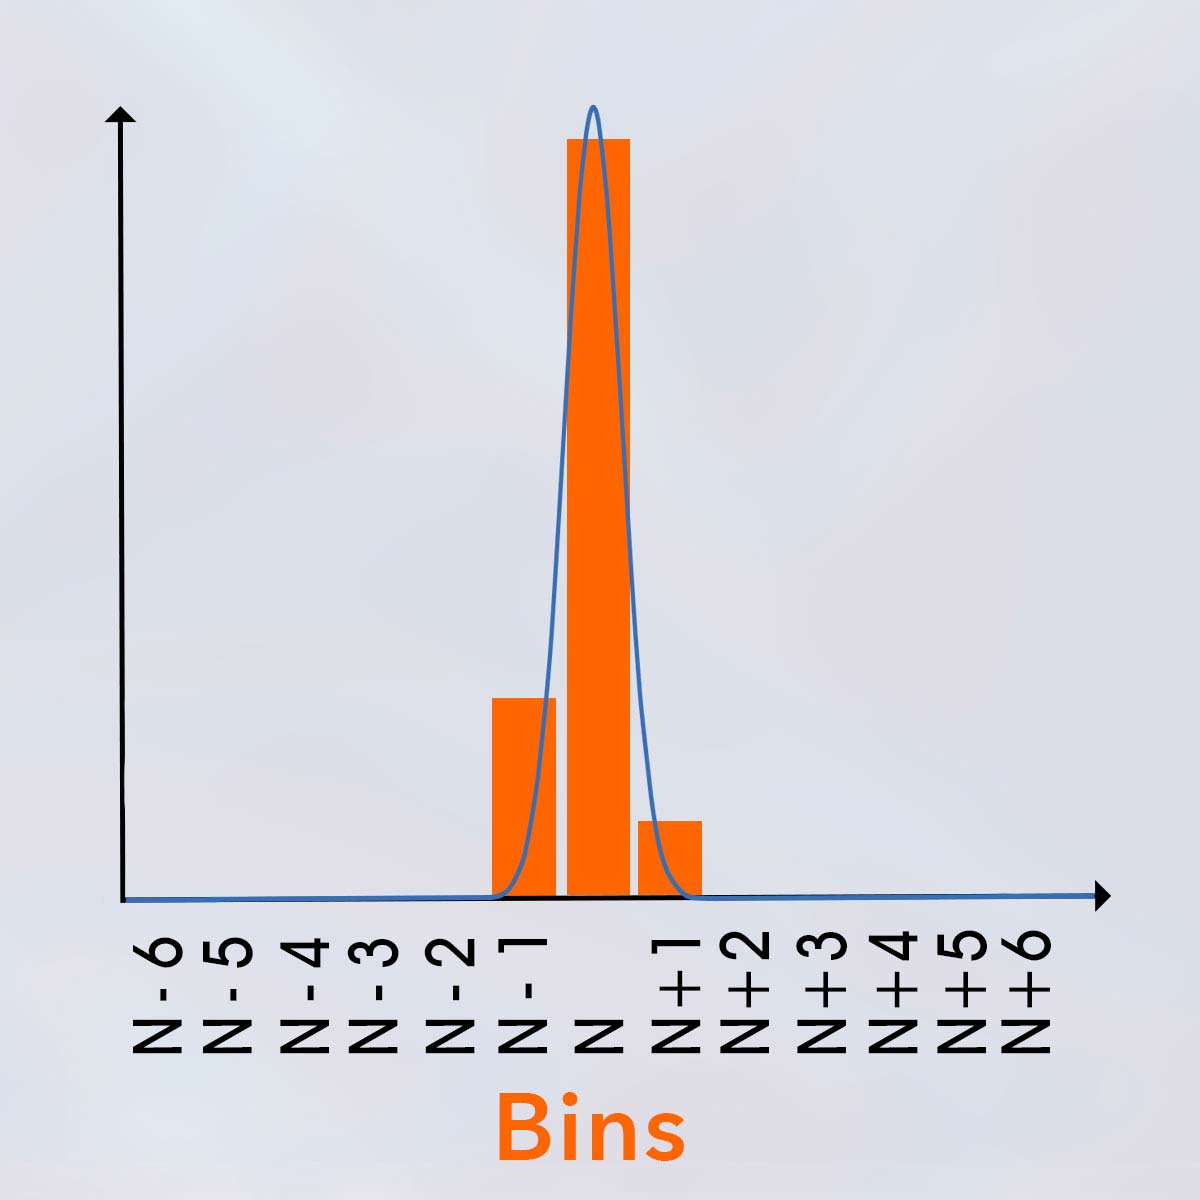
The cycle-to-cycle jitter of cronologic TDCs is much lower than their bin size. Therefore you can expect an RMS error below half the bin size for your measurements. (© cronologic GMBH & Co. KG)
bathymetry
(bathymetric measurements)
Bathymetric lidar technology can be used in both shallow coastal waters and deep oceans to record the topography of the seafloor. The resulting point clouds can be used to create nautical charts, plan shipping routes, explore oil and gas deposits, and collect environmentally relevant information about the seafloor.
The term bathymetry refers to the surveying of the topographic shape of seabeds and water beds. Whereas in the past, the creation of bathymetric maps relied exclusively on surveys using handheld lead solders or depth sounders, nowadays LIDAR systems make it possible to create precise 3D images underwater much more efficiently. Due to the strong refraction of the water, the laser beam is strongly scattered during underwater propagation, which affects image quality. When using simple LIDAR sensor technology, such measurements are limited to waters with shallow to medium water depth and low turbidity. Accurate calibration of the lidar sensor and GPS receivers can help minimize inaccuracies due to waves and reflections.
However, there are also several techniques that can be used to minimize this interference, so that such measurements can even be made from satellites:
- Atmospheric correction: Some bathymetric lidar sensors use a technique called "atmospheric correction". This involves correcting for the reflection of laser light off air molecules in the atmosphere to obtain accurate range measurements.
- Multi-frequency Lidar: some lidar sensors use multiple laser frequencies to minimize the influence of waves and reflections on the water surface. By using multiple laser frequencies, wave reflections can be identified and filtered out to obtain more accurate measurements.
- The use of special filters: there are special filters that can be applied to the measurement data to minimize interference from waves and reflections. For example, statistical filters can be used to detect and remove outliers in the measurement data.
By combining these techniques (and more), bathymetric lidar sensors can produce accurate point clouds of the seafloor even when waves and reflections are present on the water surface.
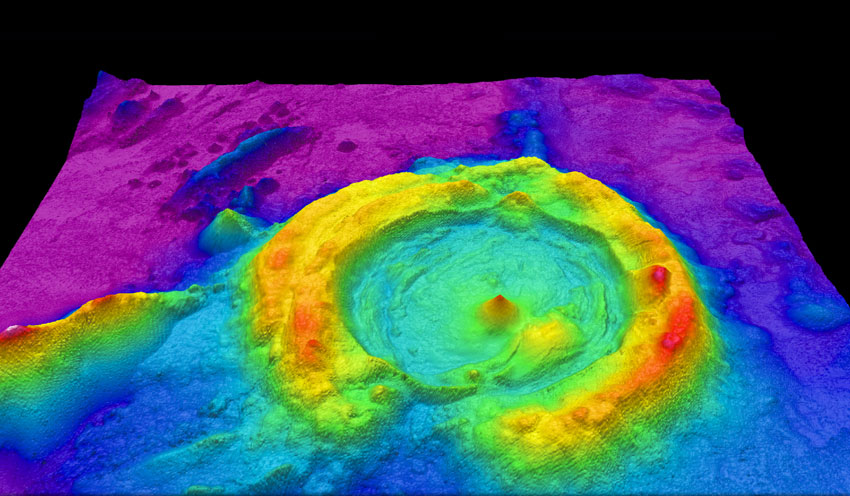
Image: High-resolution multibeam lidar map showing spectacularly faulted and deformed seafloor geology, in shaded relief and coloured by depth, by NOAA Ocean Exploration & Research, licensed under the Creative Commons Attribution-Share Alike 2.0 Generic license via Wikimedia Commons.
buncher
Pre-Buncher, Phase Buncher, RF Buncher, Radiofrequency Buncher, Velocity Modulator
A buncher is a radio-frequency cavity or resonator that groups or “bunches” ions or particles into compact, concentrated groups (bunches) as they travel in an ion beam. This helps to increase the density of the particles in certain sections of the beam, thus improving the efficiency of the ion acceleration or the interaction of the beam with a target material by focusing. Bunchers are frequently used in ion beam systems and particle accelerators.
Bose-Einstein condensate
quantum condensate, atomic condensates, matter-wave condensates, superatom state
A Bose-Einstein condensate (BEC) is an extreme aggregate state of a system of identical particles, in which the majority of the particles are in the same quantum mechanical state. This particular form of matter is created when bosons (particles with integer spin) are cooled to extremely low temperatures, close to absolute zero, causing them to enter the same ground state and act as a kind of “superatom” or coherent quantum object.
These are macroscopic quantum objects, which are characterized by the fact that none of the individual atoms contained in them can be localized. The probability of encountering any atom at a given point is therefore the same everywhere within the condensate.
The state of a Bose-Einstein condensate can be described by a single wave function and exhibits properties such as superconductivity, superfluidity, or coherence over macroscopic distances.
BECs are created using laser cooling and subsequent evaporative cooling. They have played a significant role in quantum research, as they make it possible to observe and study quantum mechanical phenomena on a macroscopic scale.
coltrims
cold target recoil-ion momentum spectroscopy, corresponding experimental setups are often called reaction microscopes, as well
Cold target recoil-ion momentum spectroscopy is a momentum imaging technique used to measure the complete fragmentation of an atomic or molecular few-body system. All charged fragments from an atomic, molecular, or surface reaction are projected onto large area position- and time-sensitive detectors. By measuring the individual particles’ times-of-flight and positions of impact on the detector, their 3D- momentum vectors are deduced. COLTRIMS measurements are coincidence measurements as many final-state fragments of single molecules or atoms are detected. Typical setups include a supersonic gas jet (i.e. molecular beam) as a target for the investigations and multi-hit capable MCP detectors with delay line position-readout for single particle detection.
common-start
triggered measurements, common-stop
In a common-start setup, time intervals are measured relative to a trigger signal on the "start"-input that is arriving before the pulses shall be measured. In such a scenario, the gate signal specifies the start time of the time measurement while the individual channel inputs end the time period.
common-stop
triggered measurements, common-start
In a common-stop setup, time intervals are measured relative to a trigger signal that is arriving after the pulses that shall be measured. In such a configuration, the individual channel inputs deliver the start signal and the gate signal stops the measurement.
constant fraction discriminator
CFD
When measuring the arrival time of pulses with a fixed threshold the time measured exhibits a measurement error that is a function of the pulse amplitude. For setups where pulses have varying amplitudes but a constant rise time, a constant fraction discriminator (CFD) can reduce this error.
However, please also note: By measuring a signal at two or three fixed thresholds with a high-resolution TDC, the same quality in terms of time walk correction can be achieved as with a CFD.
cycle-to-cycle jitter
short-term jitter, C2C jitter
Cycle-to-cycle jitter is a measure of the deviation between two consecutive clock periods and is therefore calculated as the time difference between random periods of adjacent cycles.
For many TDC products on the market, this inaccuracy is a major cause of measurement errors. However, with cronologic products, the cycle-to-cycle jitter is significantly lower than the bin size.
Our high-end TDCs, such as xHPTDC8 and xTDC4 are realized using dedicated ASICs that ensure a controlled and highly uniform bin size. Consequently, residual jitter contributions are substantially smaller than the inherent quantization error. For short time intervals, the measurement uncertainty is therefore predominantly governed by the bin size. Under these conditions, the maximum error approaches approximately half a bin, the root mean square (RMS) error amounts to about 0.8 bins, and the full width at half maximum (FWHM) corresponds to roughly 2 bins.
On the other hand there are TDCs on the market that, unlike chronologic TDCs, are based on an FPGA-implemented carry chain design and therefore have a much higher jitter that is significantly above the digital resolution. In this case, the time jitter is the limiting factor for the usable resolution of the TDC. For more detailed information on this topic, please also refer to this application note.
Caution should always be exercised when comparing jitter specifications, as different characteristics of the clock cycle distribution may be specified. Common specifications are the 1-sigma interval or the 95% interval of the distribution.
discriminator
Discriminators are circuits that are used to create a digital signal for time measurement from an analog input waveform. The simplest form is a threshold discriminator that compares the input with a fixed voltage. Commonly used are constant fraction discriminators that compare against a voltage proportional to the pulse height.
DAQ
data acquisition
DAQ is the abbrivation for data acquisition. This is the process of sampling signals that measure real (analog) physical conditions and making them available to application software. In PCs, this is achieved by data acquisition cards or with external devices such as cronologic ADCs and TDCs.
dead time
Dead time describes a time interval during which a measurement device is not capable to acquire new measurements because it is still busy processing the previous one. Our products are optimized to minimize dead time. Read out always happens in parallel to measurement without disturbing it.
digitizer
ADC
Digitizer is a common name for board-level analog-to-digital converter products with high sample rates such as our Ndigo series of products, such as Ndigo5G-10 and Ndigo6G-12.
delay-line detector
DLD
The position-readout of MCPs via a delay-line detector (DLD) is today’s best choice in the case of single-particle detection. Delay line detectors have excellent signal-to-noise properties, depict superior imaging dynamics, and, in addition, have a high time resolution. Modern delay-line detectors are furthermore multiple-hit-capable. Our TDCs are perfect companions for the readout of these detectors.
A delay-line position readout is used to measure the position of impact of a particle on a (typically larger area) microchannel plate detector with a resolution of approx. 100µm. The electron cloud, which is emitted at the location of the particle impact on the detector on the back of an MCP-stack induces a signal in a wire. The signal travels along the wire towards the wire’s two ends. By measuring the arrival time difference of the induced signal at each end of the wire, the position of impact on the wire can be deduced. In order to cover a larger area, the detection wire (i.e. the delay-line) is wound around a detector body. 2D-position of impact information can be obtained by employing a set of two orthogonal windings.
Electrical Wiring Interconnect System
EWIS
The term "Electrical Wiring Interconnect System" originates from the aviation industry and refers to the wiring system with its associated components, such as bundle terminals, wire splices, etc.) in an aircraft. The focus here is on the wiring of the systems itself. EWIS diagnostics is used in the aviation industry to ensure the continued reliability of electrical systems, even under the given extreme conditions to which they are exposed. The individual steps for inspecting and testing each component have therefore been set out in EWIS regulations. TDR measurements play a key role in the maintenance of aircraft wiring electrical systems.
FLIM
fluorescence lifetime imaging microscopy, photoluminescence decay measurements
Fluorescence Lifetime Imaging Microscopy (FLIM) is a microscopy imaging technique where time-correlated single-photon counting (TCSPC) is performed on each pixel of the image. The sample is scanned by a high-frequency pulsed laser beam, single photons of the emitted fluorescence light are detected, and the arrival time of each photon in the laser pulse period is determined by the TCSPC system and recorded in a histogram.
Read more about FLIM in this detailed article.
fNIRS
Functional Near-Infrared Spectroscopy
Functional Near-Infrared Spectroscopy (fNIRS) is a non-invasive method for brain imaging. In time-domain (TD) fNIRS the time-of-flight distribution (DTOF) of scattered photons is detected by multichannel time-to-digital converters.
frequency counting
frequency acquisition, frequency detection
In measuring the frequency of a periodic electronic signal, the number of cycles of oscillation, or pulses per second are counted. When it comes to recovering the frequency of the data pattern in a very short time or only in a few cycles, fast TDCs can improve the traditional method.
Fluorescence-correlation Spectroscopy
FCS, fluorescence lifetime correlation spectroscopy (FLCS)
Fluorescence-correlation-spectroscopy is a highly sensitive, time-resolved optical measurement method that can be used to study the mobility of fluorescent particles and molecular interactions. The widely used measurement method is based on a confocal microscope and reveals interesting biochemical parameters. During measurement fluctuations in the fluorescence emission intensity over time are recorded, which are caused by individual fluorophores that pass through the detection volume. With FCS, the size or shape of particles, diffusion constants, concentrations, and bonds between different diffusing species can be determined.
A combination of the time-correlated single photon counting (TCSPC) with the above-mentioned classic fluorescence correlation spectroscopy is called fluorescence lifetime correlation spectroscopy (FLCS). With this method, the time-resolved detection of fluorescence is used to separate the contribution of different processes to the measurement signal. The time resolution is in the picosecond range, which means that high-performance TDCs or ADCs are the best choices for data acquisition for such applications.
You might also be interested in this article about FLIM.
fluorophore
Fluorophores are molecules that emit fluorescence photons when excited from a light source. They can be utilized to visualize specific regions in cells using a fluorescence microscope.
gate inputs
In order to decrease the amount of data transmitted to the PC, some of our products include independent gating units that allow suppressing measurements during a time interval relative to the main trigger or a separate input signal.
.svg)
Gate and delay functionality: When a trigger occurs, the gate opens after a set period of time (ˮgate start“) and closes when it reaches ˮgate stop“.
Geiger-Mode LIDAR
(Flash LIDAR, GmLIDAR, GML)
GmLIDAR is a scanning range camera system. Using airborne GML-LIDAR technique, large areas can be surveyed quickly and economically from high altitudes, since a divergent laser pulse illuminates a relatively large spot on the ground. Thus, particularly fast overflights from high altitudes are possible. Small energy pulses are emitted at a high repetition rate. It is not the percentage of photons returned from a single pulse that is measured, but the percentage of pulses that causes a reflection to be registered. In Geiger-mode LIDAR the relatively large field of view on the ground is spatially resolved by the detector matrix, with all detector cells illuminated simultaneously.
The Geiger-mode LIDAR technique is characterized by a complex sensor system and a lower laser energy requirement. Here, the reflected signal is detected by an array of Geiger-mode avalanche photodiodes (GmAPD). Here, all avalanche photodiodes are operated via the application of a bias voltage so sensitively that even a single or very few photons reflected from the illuminated area lead to a sudden increase in the detector's output voltage. This so-called "Geiger-mode" gave this LIDAR technique its name. Each individual APD of the array works practically as a binary detector, which provides a stop pulse for the time-of-flight measurement by means of a TDC when photons arrive.
The GmAPD array is mounted on a scanner that rotates at a specific angle. This creates a cone-shaped field of view for accurate ground acquisition where each square meter of terrain can be scanned thousands of times in a single pass. Geiger-mode LIDAR provides only range information, not radiometric data, and is less accurate compared to full-waveform LIDAR; in addition, good weather conditions, as clear as possible, are required for aerial acquisition. The technique has advantages in situations where rapid terrain acquisition from high altitude is required.
This point cloud measured using airborne Geiger-Mode LIDAR shows the city of Chicago, Illinois. Photographer: Jason Stoker, Image rights: public domain, taken from https://www.usgs.gov/media/images/geiger-mode-lidar-over-chicago-il
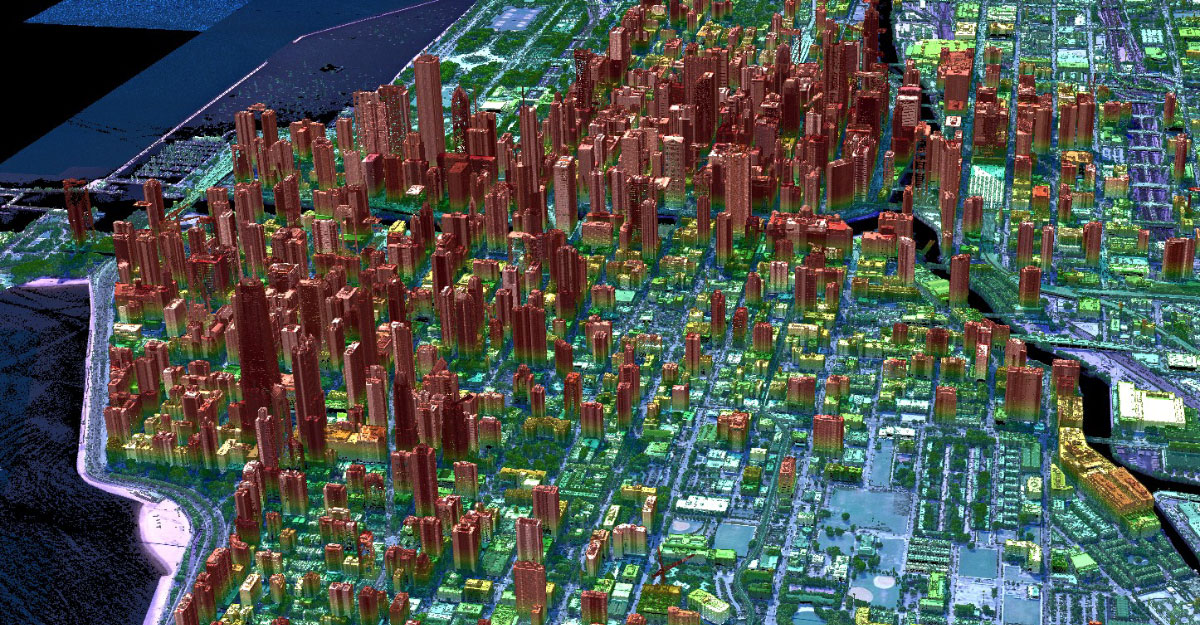
This point cloud measured using airborne Geiger-Mode LIDAR shows the city of Chicago, Illinois. Photographer: Jason Stoker, Image rights: public domain, picture has been cropped and taken from the USGS website.
hybrid photodetector
hybrid detector, hybrid PMT, HPD, hybrid photomultiplier tube
A hybrid photo detector is a device for detecting very small amounts of light. Due to the low fluctuation, hybrid photodetectors are able to precisely determine the number of photoelectrons initially generated, as long as the maximum recording capacity is not exceeded. These detectors combine the properties of photomultipliers and avalanche photodiodes and provide a narrow pulse height distribution. For measurements in the time domain, this single amplification step leads to a regular propagation time spread and thus to low timing jitter.
Incoming photons are detected by an HPD using a photocathode (e.g. made of gallium arsenide phosphide), which emits a photoelectron with the highest possible quantum yield. This is strongly accelerated within a photomultiplier tube by means of high voltage in a vacuum, so that it finally hits an avalanche diode (electron bombardment). As a result, numerous electrons are released in the APD, so that the original photoelectron is duplicated more than a thousand times. In this way, measurable signals are generated that can be used for data acquisition.
Hybrid detectors have significantly lower dead times compared to PMTs or SPADs. Due to their high quantum efficiency, their large area (compared to SPADs), and fast time resolution these extremely light-sensitive detectors are commonly used in fluorescence lifetime microscopy and fluorescence correlation spectroscopy.
impulse response function
IRF, delta-distribution, Dirac delta function, unit impulse function
Impulse response analysis is an important aspect of digital signal processing with regard to the characterization of dynamic systems, such as measurement setups. The impulse response function (IRF) describes the reaction of the dynamic system to an external change. In digital measurement technology, this characterizes the deviation of the output signal for the case that an extremely short impulse is given to the input, whereby the impulse response describes the reaction of the system as a function of time. The so-called „unit impulse function“ has zero width, infinite height and an integral (area) of one. Since it is impossible in practice to generate such a perfect impulse as input for measuring the impulse response, the shortest possible impulse is used to approximate the ideal impulse to determine the impulse response. It is important that the impulse is short enough compared to the measured impulse response so that the result is close to the true impulse response and thus still provides a usable result for assessing a measurement setup.
ICCD cameras
intensified charge-coupled device
An intensified charge-coupled device is a very sensitive image sensor consisting of a charge-coupled device (CCD) to which a micro-channel plate is coupled through fiber optics to increase sensitivity. Due to the resulting amplification of the signal, they are optimal for low-light applications.
jitter counter
A jitter counter is an instrument to measure timing jitter in clocks generators or communication systems. All cronologic TDC products can be used as jitter counters.
Josephson quantum effect
Josephson effect, Superconducting Tunnel Effect, Josephson Junction Phenomenon, Quantum Interference in Superconductors
The Josephson quantum effect is based on quantum mechanics and occurs when a tunnel current flows between two superconductors that are separated by a thin insulating layer. If two superconductors are separated by a (only a few nanometers thin, non-superconducting barrier), Cooper pairs can tunnel from one superconductor through the barrier into the other superconductor. In the static form of the effect (applying a DC voltage), a high-frequency alternating current occurs whose frequency is proportional to the voltage. The dynamic form of the effect (the effect of high-frequency electromagnetic waves), on the other hand, leads to precise frequency-voltage relationships that can be described by equations and allow for an exact method of defining voltage.
In quantum research, the Josephson effect allows for the precise control and measurement of quantum systems by generating quantized voltages and frequencies. This enables (at low temperatures in superconducting quantum circuits) reliable data acquisition and signal processing. So-called Josephson junctions, which are based on this effect, are suitable as quantum bits (qubits) for superconducting quantum computers and serve as the basis for logic operations.
LIDAR
LiDAR, and LADAR, "light detection and ranging", "laser imaging, detection, and ranging", "3-D laser scanning, Lidar mapping"
Light Detection And Ranging is a method where the round-trip time of a laser reflection is measured using a time-to-digital converter (TDC). It is used 3-D laser scanning both airborne and stationary, for computer vision especially in autonomous vehicles and meteorological measurements.
Please also read our detailed article on this topic.
low count rate detection
particle detection, radiation detection, neutron detection, Geiger–Müller counter, scintillation counter, scintillation tracker, scintillation detector
Classical Geiger–Müller counters, scintillation-based field detectors, and a lot of other particle detectors detect the radiation that is emitted by charged particles in rough spectral resolution. Quite differently, a much higher spectral resolution is implemented in low count rate detection.
Using single ion counting, low levels of radiation can be detected and characterized. In the area of radiation safety and non-proliferation small amounts of unknown nuclear material can be detected and identified using its spectra signature. Examples are special nuclear material (SNM) and shielded highly enriched uranium (HEU).
Liquid metal ion gun
liquid metal ion source, LMIS, LMIG
A liquid metal ion gun is an ion source that generates a focused ion beam (FIB) using ions extracted from a liquid metal, most commonly gallium (Ga+ ions).
Liquid metal ion sources are widely used in high-resolution analysis applications, but are also suitable for precise ion beam applications such as cutting, milling or nanofabrication.
They consist of a liquid metal reservoir that feeds a blunt tungsten tip from which a strong electric field extracts ions in the form of an electrospray. The ions are accelerated and focused onto the sample using electrostatic lenses. The generated monatomic ion beams respectively ion beams with small clusters, such as Au+, Ga+ and Au3+ are characterized by a high current density and spot sizes below 100 nm.
LMIS are more suitable for analyzing hard materials, as their small, high-energy ions can penetrate far below the surface before they release their energy. The damage this causes can make depth profiling unreliable for sensitive samples. LMIS are also used for ion implantation in the manufacture of semiconductor components and in metal finishing.
Laser-secondary neutral mass spectrometry
Laser Post-Ionization SNMS, Laser-Assisted SNMS, Laser Ionization SNMS, Post-Ionization SNMS
Laser-secondary neutral mass spectrometry (Laser-SNMS) is closely related to time-of-flight secondary ion mass spectrometry (TOF-SIMS) technology. The Laser-SNMS system combines a commercial TOF-SIMS instrument with a dedicated high-power, high-repetition-rate pulsed laser system. In this process, the material is first fragmented by the primary ion beam, releasing predominantly neutral particles. A subsequent laser pulse ionizes these neutral particles so that they can be analyzed separately. This results in a higher detection sensitivity for neutral species that are not detected in TOF-SIMS.
The ionization of the neutral sputtered particles with the laser pulse significantly increases the detection efficiency, which is advantageous for the investigation of structures in the nano range and species with low concentrations. The post-ionized particles are detected using a time-of-flight mass spectrometer. The advantage of this method is that it is not dependent on the ion yield and thus enables even more precise quantitative analysis thanks to its higher sensitivity.
However, the detection of large organic ions is challenging due to photofragmentation. The spatial resolution of Laser-SNMS is typically lower than that of TOF-SIMS because the laser pulse used for ionization covers a larger area. This results in lower spatial precision, making the method less suitable for high-resolution imaging, but it remains effective for quantitative elemental analysis on smaller areas.
Laser SNMS is used in applications where precise quantitative information about elemental composition is important, such as in geochemistry, materials research, and isotopic analysis. Its ability to detect neutral species makes it a powerful method for analyzing elements that are difficult to ionize and for investigating samples with a strong matrix effect.
TOF-SIMS is particularly suitable for qualitative chemical surface analysis and imaging, while laser SNMS offers higher sensitivity for neutral atoms and is particularly suitable for precise quantitative analysis.
MALDI-TOF
Matrix-assisted laser desorption/ionization
Matrix-Assisted Laser Desorption and Ionization is an ionization technique that can be used on large molecules with minimal fragmentation. This technology allows building time-of-flight (TOF) mass spectrometers for these molecules.
MCP detector
MCP microchannel plate detection, microchannel plate imaging, mcp imaging
Microchannel plate detectors (MCP) detect electrons, ions, or high-energy photons. They can be viewed as a further development of simple channeltrons (CEMs) and consist of a plate-shaped array of glass capillaries (between 10μm and 100μm inside diameter), which are provided with a semiconductor material on the inside. This layer on the capillary walls has electron-emitting properties, whereby the lead glass ensures a high electrical resistance between the capillaries. Each of the capillaries acts as an electron multiplier during detection: an accelerating voltage is applied between the two metalized plate sides and the capillary is arranged slightly tilted relative to the plate axis, so that incident electrons are certain to hit the wall of the respective capillary several times and generate secondary electrons again and again. These can then be recorded as measurable pulses with the help of fast TDCs or ADCs. Microchannel plates work with particularly low noise and, thanks to the matrix arrangement, also provide spatial information if required. This is beneficial for low-light imaging applications such as FLIM. Such multichannel plates are therefore also referred to as pixelated MCPs. MCP configurations with double or Z-stack MCP detectors are available for better resolution.
The following video shows an MCP detector receiving particles in a MALDI-TOF measurement:
multi-channel scaler
multi-channel detector scaler, MCS, multi-hit TDC, multi-hit converter
A multi-channel scaler (MCS) is a pulse counting instrument that records the number of events that occur during a specified time interval and provides a time-histogram of counts versus time. MCS are commonly used in single-photon counting applications. All cronologic time measurement products can be used as multi-channel scalers.
Multi-Carrier Reflectometry
MCR
Multi-Carrier Reflectometry (MCR) is a technique used to measure the reflectance of a surface or material respectively transmission lines.
It works by sending a multi-carrier signal and measuring the reflection that is returned. Such a type of digital signal is composed of several individual carrier signals that are transmitted simultaneously on different frequency bands. The carriers are modulated with data and combined to form the multi-carrier signal, which can then be transmitted. One of the main benefits of multi-carrier signals is that they can support high data rates and can be more resistant to interference and noise than single-carrier signals.
The reflection can be used to determine the properties of the surface respectively material, such as its reflectivity, roughness, and dielectric constant. MCR is used in a variety of applications, including material characterization, quality control, and surface analysis. It is a useful tool for understanding the physical properties of surfaces respectively materials and can provide detailed information about their characteristics.
Multi-Carrier Time Domain Reflectometry
MCTDR
Multi-Carrier Time Domain Reflectometry (MCTDR) is a technique for measuring the electrical characteristics of a transmission line or cable. MCTDR is a variant of multi-carrier reflectometry (MCR) in which multi-carrier signals are transmitted over the line and the reflections that return to the transmitter are measured, thus providing complete control over the spectrum of the injected signal. The reflections can be used to determine the characteristics of the transmission line, such as its impedance, attenuation, and phase shift.
In this approach to TDR measurements, the test signal is modulated as the sum of a finite number of sinusoidal oscillations and offers the advantage that the controlled spectrum of the injected signal can respond to electromagnetic compatibility (EMC) constraints. It offers the possibility to flexibly adjust the spectrum of the transmitted signal and modulate it in such a way as to allow circumvention of system-related limitations of online diagnosis by making it correspond to a specific spectral range. In this way, it is possible to avoid transmitting in a frequency band that interferes with the spectrum of the system. MCTDR is used in a variety of applications, including cable testing, fault location, and broadband transmission. It is a powerful tool for maintaining and troubleshooting transmission systems and can provide detailed information about the condition of a transmission line. MCTDR is one of the basic measurement methods in EWIS diagnostics since it can be used to detect hard faults such as short circuits and interruptions, often also intermittent defects and transient faults rather fast.
NIM
Nuclear Instrumentation Module standard
The NIM standard, originally an acronym for Nuclear Instrumentation Module, was developed in nuclear and high-energy physics in 1964. The included standards define mechanical and electrical specifications for modular systems with bus connections.
Nanowire Arrays
quantum wires
Sensors based on nanowires consist of extremely fine wires made of metals and alloys, also known as quantum wires. They generally have a diameter of less than or about 100 nanometers. Because of their tiny size and structure, they exhibit quantum mechanical properties that do not occur in materials of larger dimensions.
When the nanowires interact with the environment, such as an electric field or a magnetic field, their quantum mechanical state changes. This change can be detected by means of electronic or optical techniques, e.g. via the changes in conductivity or, if semiconductor materials are used, via the emission of light. In this way, data on the strength of a magnetic field, an electric field, or other parameters can be acquired.
Advantages:
- small size, so advantageous in applications where space constraints are a factor
- high sensitivity allows precise measurements of a wide range of physical quantities at the subatomic level
- versatility allows adaptation to specific applications and measurement requirements
- fairly fast response times are advantageous in real-time measurements and rapid analysis applications
Disadvantages:
- Due to high sensitivity, susceptible to decoherence from external disturbances such as electromagnetic interference and temperature fluctuations.
- Fabrication of nanowire sensors often requires complex nanomanufacturing and materials science techniques, which can lead to scaling and cost challenges.
Applications: Materials characterization, in nanotechnology, environmental monitoring, and medical imaging, Nanowire array-based cameras enable high-resolution imaging at the atomic level.
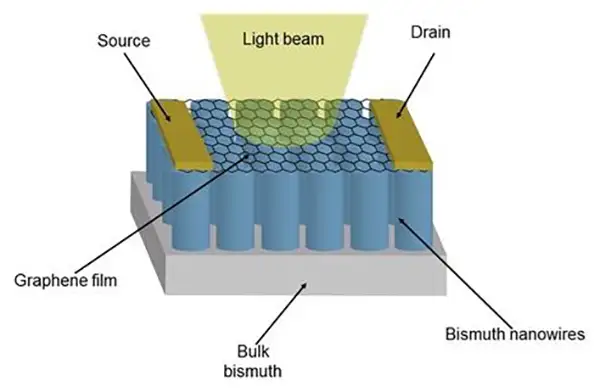
Schematic design of a novel room temperature photodetector device using semimetallic bismuth nanowire arrays in conjunction with graphene. Due to the generation and transfer of photocarrier pairs at the interface, the photocurrent generated by the built-in interface field is robust without affecting the detection spectrum. Image taken from Photocurrent in Bismuth Junctions with Graphene by courtesy of Tina Brower-Thomas.
Nitrogen Defect Centers
NV centers
Nitrogen vacancy centers are defects of the diamond crystal structure: a nitrogen atom is present instead of one of the carbon atoms, and one of the neighboring positions in the lattice is vacant.
A specially prepared diamond is irradiated with a green laser, which puts the NV centers into an excited state. In this state, the NV centers can emit light and also change their quantum states when they interact with an external magnetic field. (Here, spontaneous parametric downconversion is used to create entangled signal photons with perpendicular polarization from pump photons. After data acquisition, the emitted light is analyzed using ADCs or TDCs to obtain information about the magnetic field that affected the NV centers. By evaluating the polarization & possibly the intensity of the light, the magnetic field strength and direction in the vicinity of the NV centers can be determined. Such measurements using quantum sensors based on NV centers are absolute, operate at room temperature, and require no separate calibration. Therefore, the methods are robust and reproducible. Consequently, current flows of micro- and nanoelectronic circuits can be imaged with high resolution in this way.
Advantages:
- High sensitivity precision, and long-term stability in magnetic and electric field measurements.
- Robust and easy to control.
- Operates at room temperature.
Disadvantages:
- Limited spatial resolution and frequency range.
Application areas: optical magnetometry, nitrogen defect magnetometry, nanotechnology, materials science, quality control in microelectronics, biomedical research, and quantum information technology.
![Schematic of a nitrogen vacancy centre in the diamond lattice, viewed along the [100] axis.](https://cdn.prod.website-files.com/5f758069ff88881482767cd7/64df2e906c5afade39dd80a8_NV(100)withVacancy.png)
Schematic of a nitrogen vacancy centre in the diamond lattice, viewed along the [100] axis. The dark blue sphere indicates a substitutional nitogen atom whilst the shaded region indicates a vacancy. Carbon atoms are shown as grey spheres, whilst bonds between atoms are shown as grey sticks. Image source: Baggerchap via Wikimedia Commons
withVacancy.png)
Noise Domain Reflectometry
NDR
In Noise Domain Reflectometry, the reflectometer uses significant noise or broadband signals already present on the line, rather than feeding a signal into the line to locate intermittent faults on live lines. It is therefore a passive test method that provides an estimate of the distance to a fault and allows online measurements.
Although the measurement here uses a signal that is not controlled in terms of generation, it can be used as a reflectometry test signal because impedance discontinuities are reflected regardless of the origin of that signal. For any signal with significant noise or noise-like behavior during the test period, the correlation of this signal with reflections occurring on the line results in a correlation pattern. Thereby, the peaks of this correlation pattern indicate the location of each reflection. In cable networks, multiple reflections occur, and each reflection can be observed independently of the others. The resolution of detection is directly related to the bandwidth of the tested signal.
This method is particularly useful for testing live cables, where data integrity on the cables is critical. NDR measurements can therefore be used, for example, to monitor aircraft wiring in flight or in applications where a secure connection is desired. Similar to SSTDR, in this case, the length of the line is determined by correlation. In other words, the method observes how similar or different the incident and reflected signals are and in what time intervals they are synchronous. The peaks of the determined correlation functions are used to determine the length of the wire.
NDR provides the ability to locate impedance discontinuities that are significant enough, such as substantial damage to the wire. Impedance changes of a few ohms, such as those caused by moisture, small chafe marks, or wire fraying, cannot be detected with NDR. In this regard, TDR measurement methods should be preferred. Thanks to the ability to test the cable under voltage, intermittent short circuits (arc faults) are detected by NDR as if they were short circuits (which produce a significant reflection), even if only for a short time. Intermittent open circuits can also be detected.
nanoscale SIMS
nano SIMS
NanoSIMS is specifically designed to provide extremely high spatial resolution and is therefore suitable for isotopic analysis and quantification of light elements and isotopes. Most SIMS methods are difficult to implement in nano dimensions. This is due in particular to the often too large diameter of the primary ion beam and the vibrations that occur. This is because very small volumes have to be sputtered precisely for nanoscale imaging.
Modern NanoSIMS devices use primarily focused Cs+ or O- ion beams and enable subcellular resolution and thus absolute quantitative analysis at the organelle level. A high-energy primary ion beam is used to achieve subcellular spatial resolution in the range of ∼0.05 μm. The ion source in NanoSIMS is optimized for high beam stability and precision. The analyzed molecules are usually labeled with stable isotopes, which makes sample preparation very time-consuming.
Magnetic sector field detectors are generally used for the analysis. Only a low sample throughput is achieved. Due to its ability for fast mass analysis and versatility, TOF-SIMS is preferred over nanoscale SIMS in a variety of industrial and scientific applications.
Optical Coherence Tomography
OCT
Optical coherence tomography is a high-resolution imaging system. It obtains 2- and 3-dimensional images from scattering materials (e.g. biological tissue). As a non-invasive diagnostic instrument, it is mostly used for ophthalmological examination of the retina. In this application, analog signals are sampled with ADCs so that the resulting digital pattern represents the analog signal as a function of the change in wavelength of the light source.
OTDR
optical time-domain reflectometry
In optical fiber communications, the losses in optical fibers can be measured with optical time domain reflectometers. The measuring method works similar to radar but works with very low light levels and helps to localize poor fiber splices or faulty optical components.
In Optical Time Domain Reflectometry a fast light pulse is injected into the measured system (for example a fiber optic line). OTDR measurements are similar to TDR measurements, but are based on emitting a series of light pulses, e.g. by means of a laser. Here, the time of the reflections is determined from the reflection loss by measuring from the same end of the fiber how much light passes over the Rayleigh backscatter or is being reflected from individual locations along the fiber. OTDR measurement technology provides a snapshot of the entire connectivity of fiber optic networks, including all link points, splices, and fiber sections.
With help of a fast ADCs or TDCs the time parameters of the reflections and scatterings are measured in order to determine the location of the fault.
Please also read our detailed article on this topic.
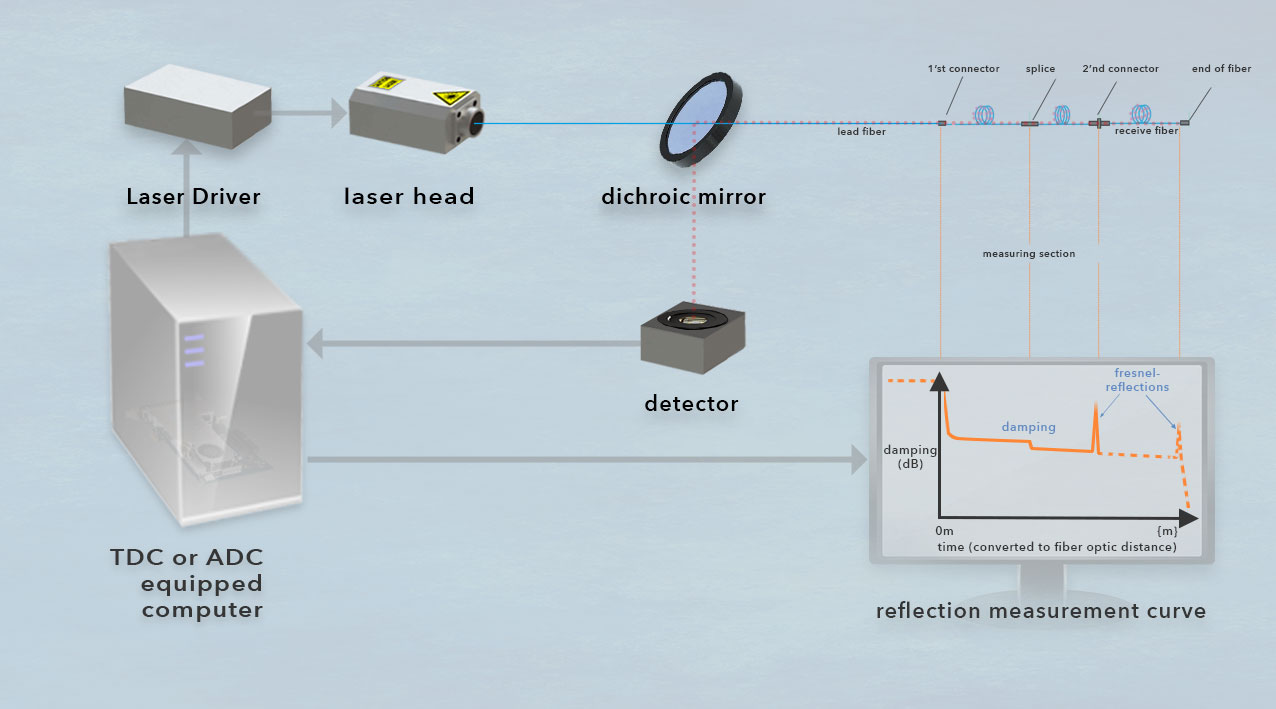
Scheme of an OTDR measurement setup for an optical fiber: A light source (in this case a laser) generates a light pulse with a known pulse length and wavelength, which is coupled into the fiber (blue). The distance to be measured is between a lead fiber and a receive fiber. Light is permanently scattered back by Rayleigh scattering (pink), e.g. fiber splices lead to measurable signal attenuation. Events with Fresnel reflections (e.g. by connectors) reflect larger portions of light. The returning light is directed into a detector and analyzed. The emission of the pulse serves as a start signal for an analog-digital converter. Thus, a measurement can be made of the time it takes for the pulse to reach a reflective event and return to the detector of the measuring device. During this measurement, the pulse passes through the fiber. The pulse is reflected at the end of the fiber at the latest, which means that fiber breaks can also be localized. As a rule, additional reflections or attenuations of the signal already occur on the way to the end of the fiber, e.g. at splices or connectors, indicating their distance from the pulse source. (© cronologic GMBH & Co. KG)
Orbitrap
Orbitrap-based mass spectrometers
Orbitraps belong to the category of ion traps and utilise the axial oscillation of ions in an electrostatic field to measure their frequency. The frequency is measured by detecting the current generated by the oscillating ions. These signals are then subjected to a Fourier transformation to generate a mass spectrum.
An Orbitrap consists of a central spindle-shaped electrode core and a surrounding hollow cylindrical electrode. The ions are injected into an electric field that is generated between these electrodes. The shape of the electric field causes the ions to move both axially and radially as these move orbitally around the central electrode, but also oscillate axially along the longitudinal axis. The frequency of the axial oscillation depends on the mass-to-charge ratio (m/z) of the ions.
The minimum electrical current that the ions induce in the surrounding electrode is amplified and recorded using ADCs. A Fourier transformation (FT) is applied to the transients recorded in this way and converted into frequency domain spectra. As these frequencies are directly proportional to the square of the m/z ratios of the ions, the measured frequency spectrum can be converted into a mass spectrum.
Orbitraps offer a very high mass resolution (up to 1,000,000) and mass accuracy, often in the range of a few ppm.
Optical return loss
ORL, fiber attenuation
In telecommunications optical return loss (ORL) is a measure of the quality of a fiber optic link or connection. It is expressed in decibels (dB) and stated as a negative value. It represents the power ratio of the signal reflected back from a fiber optic component or connection compared to the power of the signal transmitted through the component or connection. A high return loss indicates e.g. dirty or badly inserted connectors or a broken optical fiber. It thereby creates multipath interference and degrades the signal.
Optical return loss in glass fiber can be caused by a variety of factors, including:
- Reflections from the fiber ends or connectors
- Bends or twists in the fiber that cause light to be reflected
- Splices or other defects in the fiber that cause light to be scattered
- Inhomogeneities in the fiber core or cladding that cause light to be reflected back
- Temperature changes that cause the refractive index of the fiber to change, leading to reflections
In Practice, optical return loss can be determined using OTDR measurements. High optical return loss can cause signals in a fiber link to be transmitted improperly. The measurement of return loss is therefore becoming increasingly important in the characterization of optical networks. This is especially the case as the use of wavelength division multiplexing, which has a lower tolerance for ORL, increases.
ORL is different from insertion loss. The latter describes the loss of signal power that occurs when a device is inserted into a transmission line. In this context
absorption, misalignment, or an air gap between the fiber components are the main causes contributing to insertion loss.
As network requirements in data centers have increased, attention to ORL has increased, which concerns especially connectors with their different ORL values. When connectors are repeatedly coupled and decoupled, the ORL value also deteriorates. Minimization of back reflection is achieved by special polishing techniques.
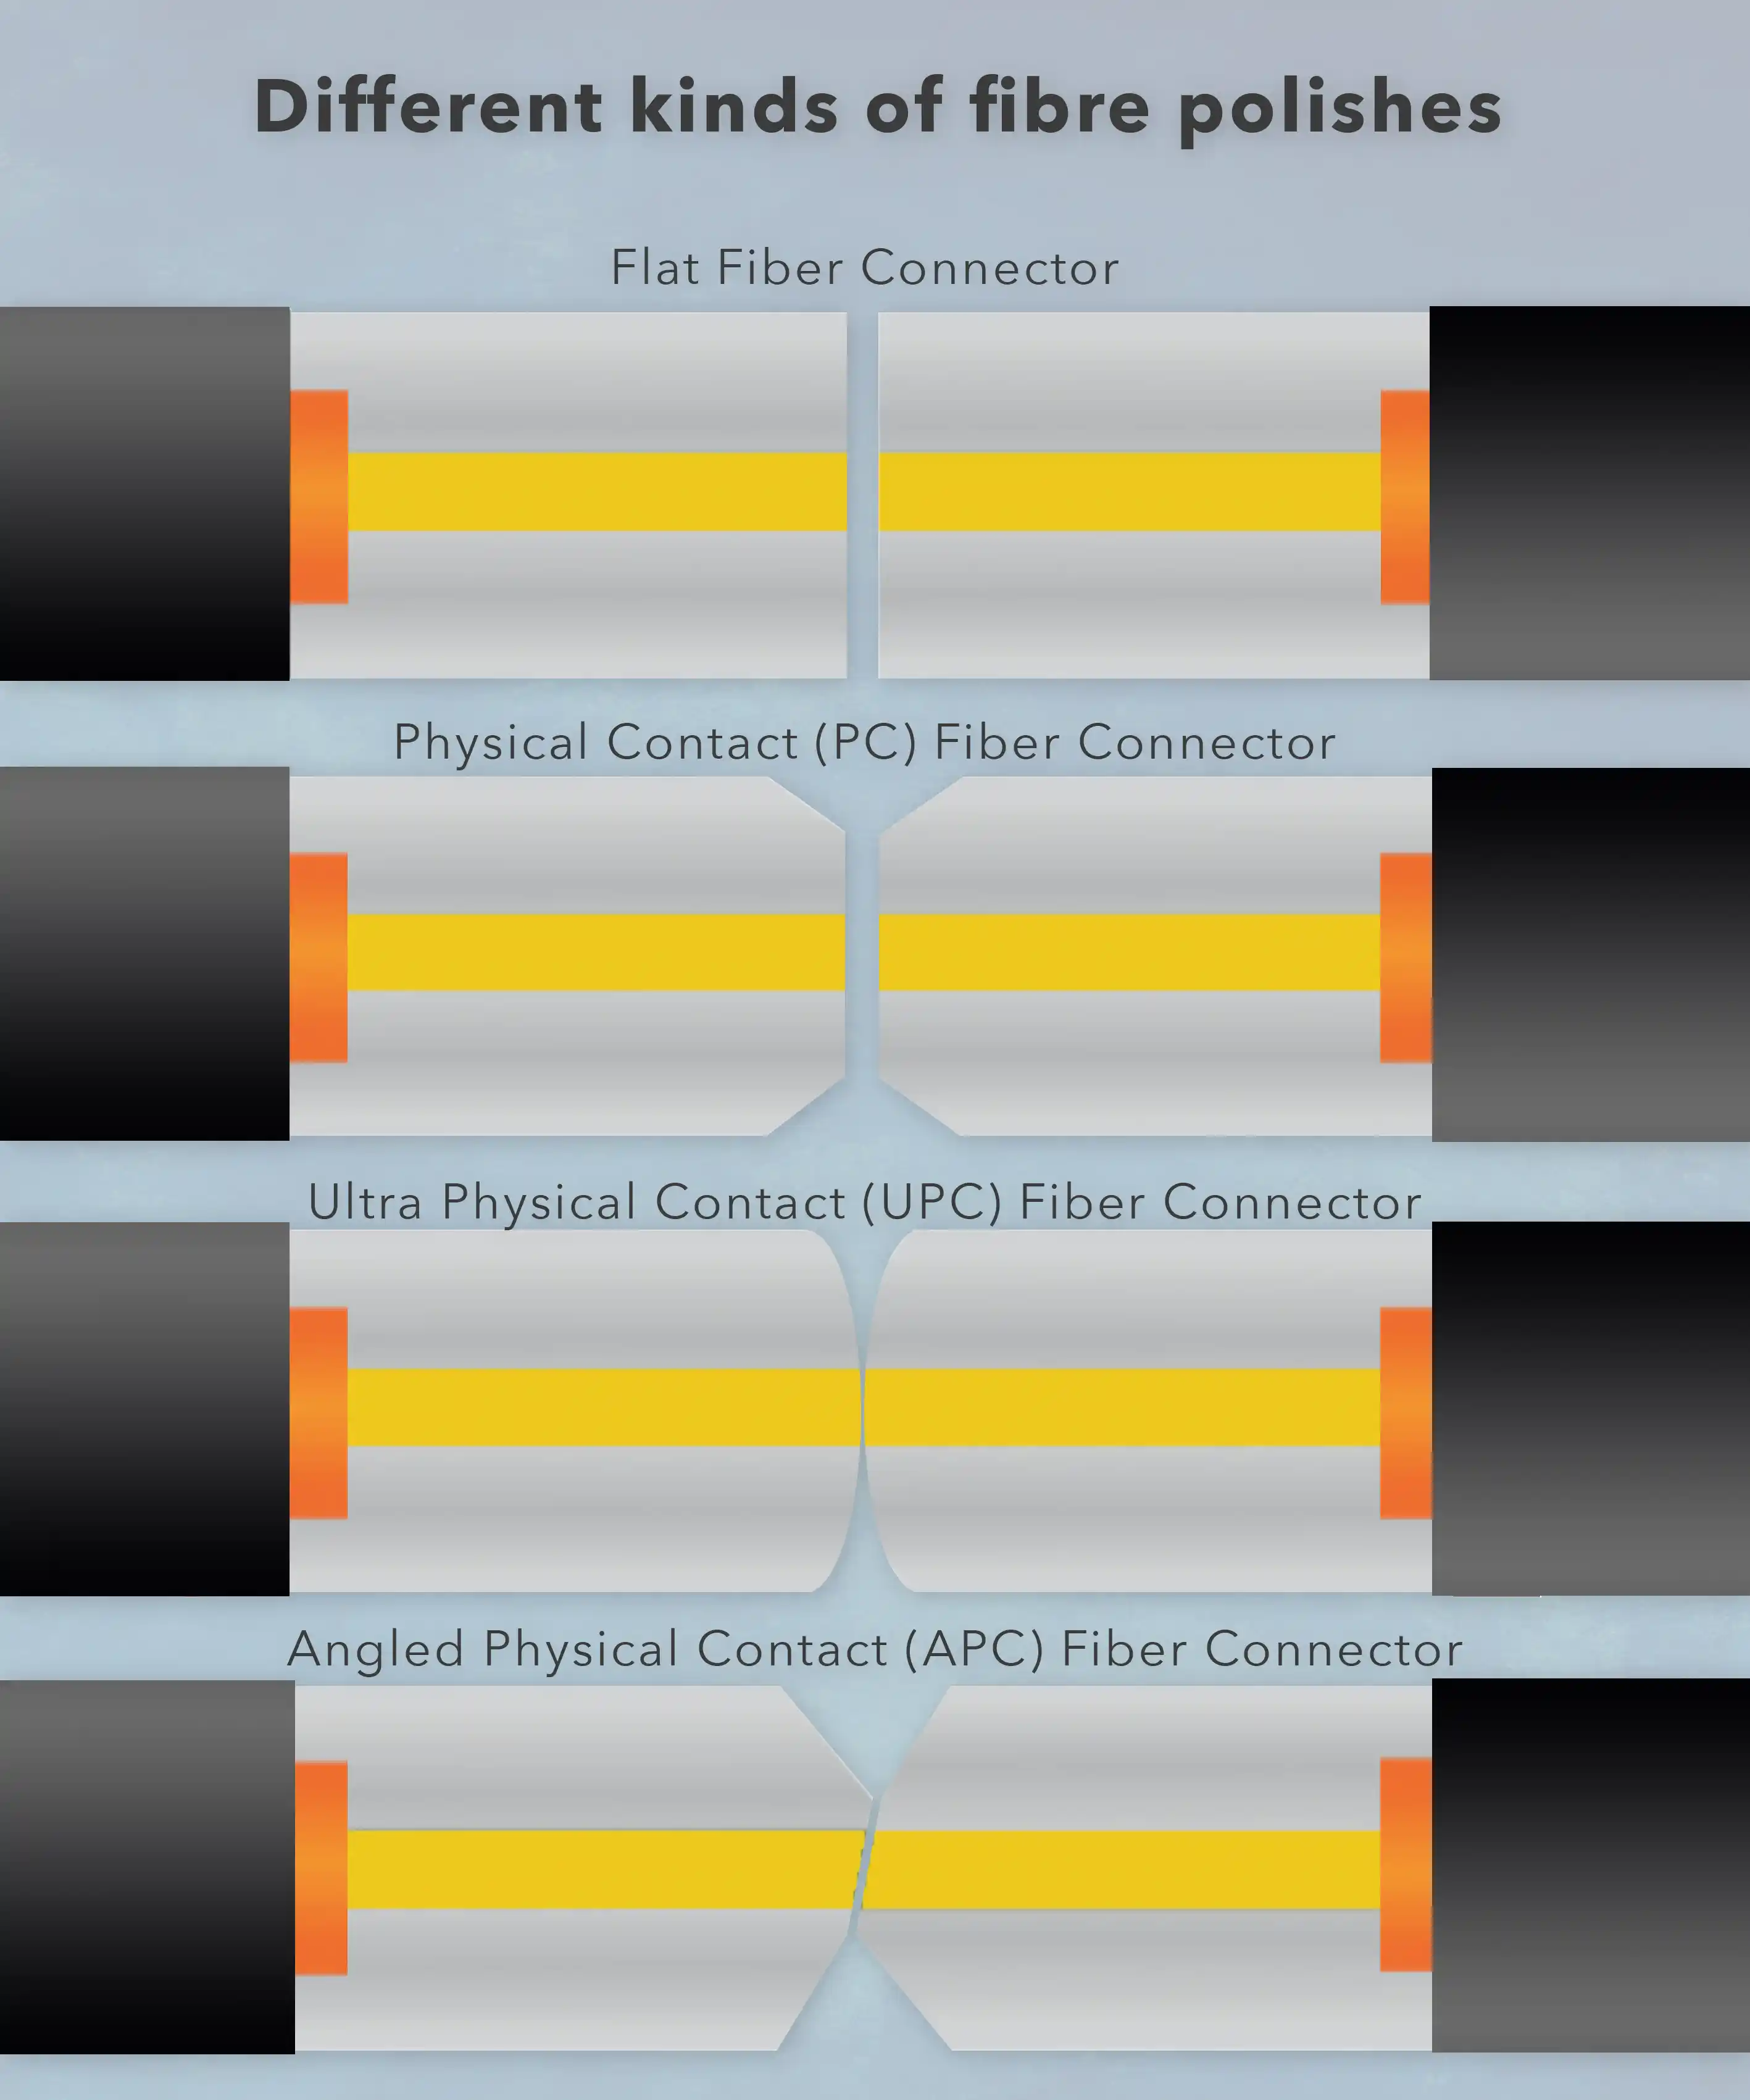
Image above: When two flat fibers are coupled using flat connectors, a small gap remains between the two fiber surfaces, and strong reflections occur at the surfaces (ORL values around -35 dB).
Physical Contact (PC) connectors are polished and have a slightly tapered design with a smaller end face, so less light is reflected back into the fiber, resulting in an ORL of about -45 dB.
Special polishing methods of the convex fiber end face distinguish the so-called Ultra Physical Contact (UPC) connectors. They have an even lower ORL value of up to -55 dB, can be used with both singlemode and multimode optical fibers, and enable more consistent signals in digital television and telephone systems.
The end faces of the APC (Angled Physical Contact) connectors for single-mode fibers have convex edges but are also angled at 8 degrees, allowing a much smaller gap between the fiber ends and closer contact with less pronounced reflections. ORL values for these connectors are less than -65 dB.
Orthogonal Multi-tone Time Domain Reflectometry
OMTDR
In OMTDR-based reflectometry, an OFDM signal is fed in, which is a signal that uses multiple mutually orthogonal carriers for digital data transmission in order to avoid interference between reflectometers connected to an identical network. Thus, the test signal itself is used to transmit information.
In this variant of TDR measurements, multiple sensors are used at different ends of the network to maximize diagnostic coverage, even for complex networks. After all, due to signal attenuation due to the distance traveled and the many nodes, this is a challenge. The idea of the OMTDR measurement method, much like MCTDR, is to divide the bandwidth into multiple sub-bands with orthogonal and then overlapping sub-carriers, which allows maximization of spectral efficiency and control of the full spectrum. It is then possible to avoid the unwanted frequency band by canceling the corresponding part of the OMTDR signal.
The aim of OMTDR is to control the total measurement bandwidth, increase data rate and spectral efficiency, and avoid interference. OMTDR provides communication between sensors to overcome ambiguity in fault localization, thus improving soft fault detection. For example, the reflected signal can be acquired for different load conditions to detect soft faults such as insulation defects. For this purpose, the reflected signal is correlated with the transmitted signal. The result is a reflectogram, which shows corresponding maxima (correlation peaks) at the points of the cable sections that are not matched in terms of impedance. The reflectogram helps to localize soft errors and to estimate the severity of these faults by displaying the time responses.
PALM microscopy
photoactivated localization microscopy, PALM imaging, Single-molecule imaging, Single-molecule localization microscopy, SMLM, single-molecule microscopy
Photoactivated Localization Microscopy (PALM) is a super-resolution imaging technique that achieves nanometre-scale resolution by exploiting the properties of photoactivatable fluorophores to reveal spatial details of tightly packed molecules. This method enables the detection of individual molecules such as proteins in a cellular context. The method offers a high level of detail when depicting 3D structures in cell bodies and works like this:
Exposing fluorophores to low-power activating lasers of a certain wavelength leads to a change in their emission spectra. This conversion is implemented stochastically so that only a few fluorophores will turn into their active state. The stochastic excitation of the fluorophore ensures that each fluorescence point comes from a single fluorophore. A high-power laser beam briefly exposes these activated molecules, after which they are immediately returned to their inactive state (e.g. by photobleaching). This process is then repeated over thousands of images and the frames are merged into a super-resolution image.
photon counting
single-photon detectors, SPD, detection of individual photons, photosensors, multi-pixel photon counter
See also: TCSPC. In single-photon counting, a single-photon detector (SPD) emits an electric pulse every time a photon is detected so that individual photons can be counted. Photon counting is used in telecommunication, biophysics imaging (e.g. FLIM), quantum optics and high-resolution (single-pixel) LIDAR, OTDR (optical time-domain reflectometry) and Quantum Key Distribution (QKD).
PXI
PCI eXtensions for Instrumentation
PCI eXtensions for Instrumentation is a bus system for measurement and automation technology. It is based on the older xPCI bus technology but uses the point-to-point PCI express standard for communication. Our standard PCIe products allow customers to build systems that deliver the same performance as a PXI setup at a fraction of the cost.
photomultiplier tubes
PMT
PMTs convert light into electrons and then amplify the electron signal. Classic photomultiplier tubes (PMT) work in the ultraviolet, visible, and near-infrared range of the electromagnetic spectrum. These are electron tubes that pick up weak light signals (up to individual photons) and amplify them to such an extent that free electrons produce more free electrons of lower energy, whereby the weak input signals are converted into measurable currents. They typically consist of a photocathode and a downstream secondary electron multiplier (SEM) in an evacuated glass bulb. PMTs can have dead times of tens of ns. A further development of the PMT, the hybrid photodetector, combines this with avalanche photodiodes.
PMTs are used in scintillation counters, fluorescence spectroscopy, astronomy, medical imaging, and other applications. They are ideal for detecting photons with high time resolution. As a rule, several high-voltage points (typically 500–1500 V) are required at the dynodes for operation.
point cloud
(point cluster)
A point cloud is a collection of three-dimensional coordinate points that represent the surface of a real or virtual object or, in other words a network of georeferenced data points. Each point in the cloud represents the position of a surface point in 3D space, and is typically represented by a set of x, y, and z coordinates. It can be created by various methods such as 3D scanning, structured light scanning, laser scanning, photogrammetry or even simulation.
A point cloud usually does not contain any other information such as colors or textures, but consists only of a collection of points with their coordinates. However, the point cloud can serve as a basis for further processing steps such as 3D modeling or metrology. Mostly point clouds are used to create 3D models of objects or environments, and can be visualized using specialized software. Point clouds are used in many application areas, such as 3D computer vision, architecture, engineering, surveying, robotics or virtual reality.
For example, such a three-dimensional point cloud might be the result of LIDAR measurements, where a spatial assignment is made for each point in the vector space by means of a big data analysis. The cloud of data points is described by the points it contains, each of which is captured by its spatial coordinates. This approach enables the representation of a surprisingly accurate 3D model of reality. In this context, the point density is an essential factor for the detection of objects and the possible resolution the in the field of visualization.
This image shows a point cloud measured using airborne lidar shows the city of Chicago, Illinois. It was measured using a Geiger mode LIDAR. Photographer: Jason Stoker, Image rights: public domain, picture has been cropped and taken from the USGS website.
Quantum key distribution
QKD
The quantum key distribution enables tap-proof encryption of data. For this purpose, the quantum properties of light are used to transmit encrypted data. Single-photon sources (SPS) are used for optimal performance. Our fast TDCs can be used in single-photon counting receiver modules that convert single-photon detection events into streams of timestamps.
Read more about quantum research in this article.
quadrupol mass analyzers
QMS, QTOF, TQMS
Quadrupole mass analyzers can be used as an upstream mass filter in TOF mass spectrometry (QTOF). With their help, all ions can be eliminated for the detection of certain substances that are not within the desired range from mass to charge. A quadrupole mass analyzer consists of the arrangement of two oppositely identical electrical or magnetic dipoles with a fixed distance over their entire length. In mass filter analysis with an electric quadrupole, the inertia of the introduced particles is used for selection: the light particles are destabilized in one of the levels and the heavy particles in the other level by means of an applied alternating voltage. Quadrupoles can also be used to focus the ion beam in a mass spectrometer, e.g. to align the ions with a collision cell and to record the fragments produced there by means of time-of-flight measurement.
Note: There are also mass spectrometers that use quadrupoles and similar arrangements to record an entire mass spectrum (QMS). In terms of their detection capabilities, these do not come close to the performance of the TOF-MS, because in these devices the stability range is scanned over the entire m / Q range and a new measurement is carried out at every step. As a result, such measurements require a significantly higher investment of time. Triple quadrupole mass spectrometers (TQMS) should also be mentioned at this point. These are tandem mass spectrometers, which consist of two quadrupole mass analyzers connected in series and are separated by a (non-mass-resolving) high-frequency quadrupole, which serves as a cell for the collision-induced dissociation. The aim is to increase the sensitivity of the measurement. However, this coupling does not achieve the performance of a TOF measurement either.
Quantum Coherence
quantum entanglement, quantum decoherence
Quantum coherence is a term from quantum physics that describes the ability of a quantum mechanical system to stably maintain its quantum mechanical states and generate interference patterns. In a coherent state, quantum states are precisely defined and exhibit regular and predictable behavior. This allows accurate measurement and control of the quantum mechanical properties of the system.
However, interactions with the environment always cause incoherence, especially in quantum physics. Such interactions lead to phase shifts and uncertainty in the quantum mechanical states, causing the coherence to fade and the system to become decoherent. Quantum coherence is therefore a delicate state that can only be maintained for limited times in many quantum mechanical systems.
Preserving quantum coherence is critical for many applications in quantum technology, including quantum computing, quantum communications, and precision measurements. Researchers are working on strategies to minimize decoherence, such as improved quantum sensor isolation, error correction techniques, and quantum error tolerance protocols. Understanding and controlling quantum coherence are therefore key challenges in quantum physics and for the development of powerful quantum-based technologies.
Quantum Hall Effect Sensors
QHE-sensors, Hall resistance
The "quantum Hall effect" is a quantum mechanical phenomenon that occurs in two-dimensional electron gases in a strong magnetic field. This effect makes it possible to measure electrical conductivity in quantized steps, allowing extremely precise measurements of electrical resistances and magnetic fields. For this purpose, a sample is prepared from a two-dimensional electron gas (2DEG). The 2DEG is typically produced in semiconductor materials, in particular in so-called semiconductor heterostructures. A semiconductor heterostructure is a material consisting of different semiconductor layers, each of which has different electronic properties. When electrons are introduced into such a heterostructure, they can be "trapped" at the interface between the different layers and move only in a thin, two-dimensional layer. This sample is cooled in a strong magnetic field to induce the quantum Hall effect, in which there is a quantization of the electrical resistance (into integer multiples of the so-called "von Klitzing constant"). The electrical resistance of the sample is measured by passing an electric current through the sample and detecting the voltage across the sample using ADCs. Since the quantum Hall effect depends directly on the strength of the external magnetic field, the measurement of electrical resistance can also be used to accurately determine magnetic field strength.
Advantages:
- Extremely accurate in measuring electrical resistance and electric fields.
Disadvantages:
- Requires low temperatures and special materials. Susceptible to external interference.
Applications: Precision metrology, materials research.
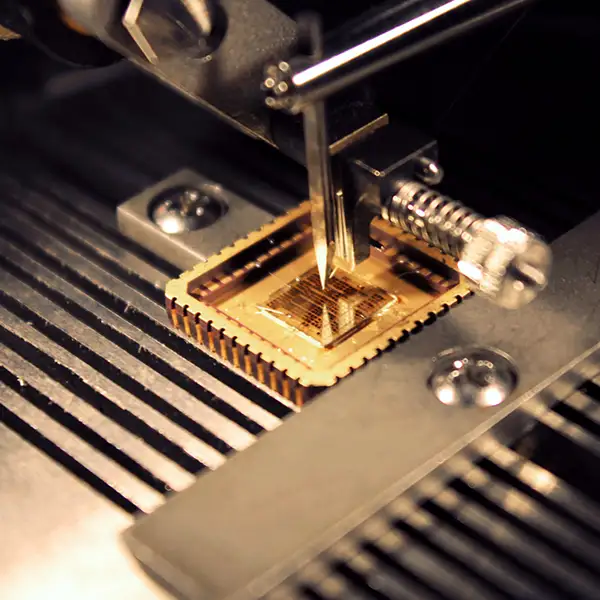
The figure shows a Quantum Hall Effect chip from the manufacturer graphensic with a chip size of 3.5mm*3.5mm, on a 350 μm substrate (semi-insulating SiC with single-layer graphene), which can accommodate up to 9 Hall bars. The graphene, with correct tuning, allows to observe the quantum Hall effect at relatively low magnetic fields and high temperatures, here at T ≤ 4K, B ≥ 5T. Kind thanks to Amer Ali of graphensic for the permission to use this photo.
Quantum-Based Inertial Sensors
Quantum-based inertial sensors are still in the research and development phase, but their promising properties could lead to significant advances in precision measurement and navigation. They use the principles of quantum mechanics to make high-precision measurements of acceleration, velocity, and rotation along three mutually perpendicular axes. Quantum mechanical phenomena such as atomic interferometry and quantum coherence are used to increase the sensitivity and accuracy of the measurements.
In a typical quantum-based inertial sensor, atomic beams (atoms or molecules) are brought into so-called "superpositions" of quantum mechanical states with the help of laser beams. These superpositions make it possible for atoms to exist simultaneously in different states. When the atoms come back together, characteristic interference patterns are generated.
By applying acceleration, velocity changes, or rotations to the atomic beam as it moves, the interference pattern can be affected. Measuring and analyzing these interference patterns in this way allows precise determination of the changes in acceleration, velocity, or rotation.
Advantages:
- exceptional accuracy and precision in measuring acceleration and rotation for many applications
Lower tendency to drift compared to classical inertial sensors, resulting in more stable and reliable measurements
Disadvantages:
- complexity in manufacturing
- often low temperatures near absolute zero are required to maintain quantum mechanical states.
- the use is usually associated with high cost
Applications:
Aeronautics, space, robotics, geodesy, and earthquake monitoring.
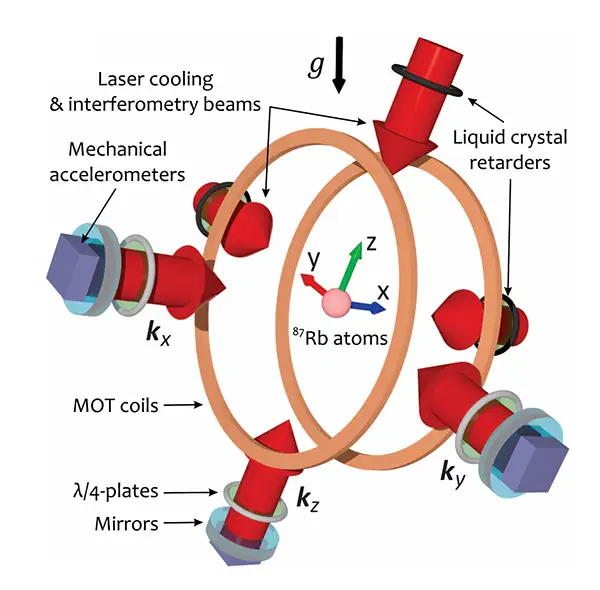
Design concept and geometry of the hybrid quantum inertial sensor (Quantum Accelerometer Triad – QuAT): the different components of acceleration are measured perpendicularly to the surface of the respective mirrors. Image via via Wikimedia Commons, Quantum Accelerometer Triad – QuAT © iXAtom / Exail / LP2NS. Templier and al, Science Advances (2022) / DOI: 10.1126/sciadv.add3854
reciprocal counter
A reciprocal counter measures a frequency by measuring the time between a certain number of edges of a clock signal. This is opposed to the approach of a simple counter that counts the number of signal edges in a certain time interval. All of our TDCs can be used as reciprocal counters with very high precision. To measure frequencies that are higher than the maximum count rate of a given TDC an external prescaler is required.
reflectron
mass reflectron
A reflectron is used to improve the mass resolution in a mass spectrometer. It is used to reverse the direction of the ions by creating an electric field with a gradient. The field decelerates the ions and then accelerates them again in the opposite direction. This reduces the influence of their kinetic energy distribution on the flight time, because the ions with higher kinetic energy penetrate deeper into the electrical field of the reflector and cover a correspondingly longer distance, which largely compensates for the flight time differences.
The background to this feature is, that it is technically not exactly easy to ensure in a mass spectrometer that all ions really absorb the same amount of energy. During the measurement, the sample is in a gaseous state, which means that the energy distribution of the gas particles within the ion source follows a Boltzmann distribution. During the acceleration phase, different parts of the sample are therefore exposed to the electric field to a greater or lesser extent than others. As a result, they do not consume the same amount of energy, which would, however, be a prerequisite for correct measurements. Therefore a deviation occurs and particles with the same mass-to-charge ratio are nevertheless accelerated to different speeds. These ions have different kinetic energies and this energy dispersion acts as a blurring in the mass spectrum. The energy dispersion can be minimized with the help of a reflector.
See graphic below:
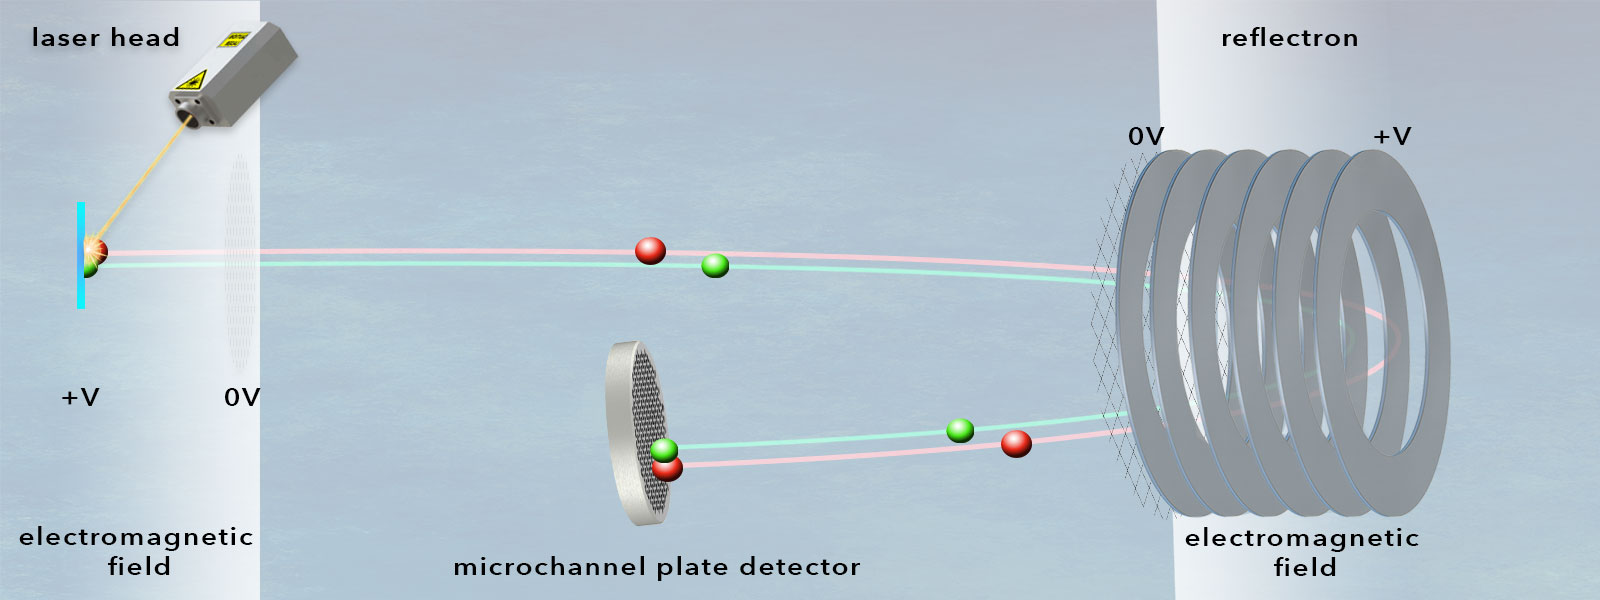
The single-stage reflector uses a homogeneous field and can compensate for small energy fluctuations in the ions leaving the ion source. In the reflection by means of such an ion mirror, the more energetic ion (red) travels a longer distance but arrives at the detector at the same time as the lower-energy ion (green) of the same mass. (© cronologic GMBH & Co. KG)
Raman scattering
Raman effect, Smekal-Raman effect, Raman process, Raman instability
Raman scattering is a form of inelastic scattering of light or other electromagnetic radiation by electrons, atoms, or molecules. Raman scattering can occur when light enters gases, plasmas as well as crystalline solids (phonon Raman scattering), and is due to the interaction of photons with the relevant particles of the medium involved. Such interactions concern, for example, rotational and vibrational energy in molecules or energy quanta of lattice vibration (optical or acoustic) phonons, in solids. In molecules or crystals, energy transfer can occur between the exciting photon and the excited matter, so that the rotational and vibrational energy of the involved molecule or the vibrational energy in the crystal lattice changes - i.e. there is a transition of the molecule from one energy level to another.
The term "inelastic" describes the fact that this type of scattering changes the kinetic energy of the particles involved. So there is an energy transfer between the radiant energy and the scattering medium, where the scattered light has a higher or lower frequency than the incident light beam. So there is an energy transfer between the radiant energy and the scattering medium, where the scattered light has a higher or lower frequency than the incident light beam. The respective frequency is specific for the scattering atom or molecule. If the frequency of the exciting photon is resonant with an electronic transition in the molecule or crystal, the scattering efficiency is increased by two to three orders of magnitude (resonance Raman effect). In the case of such inelastic scattering, the energy balance causes a frequency shift of the scattered light. Both directions of energy transfer are possible.
Raman scattering of molecules is characterized by a very small scattering cross-section. Consequently, a rather high concentration of molecules is needed to obtain detectable signals. Therefore, Raman spectra for single molecules are not possible. However, if the molecule is close to a metallic surface (e.g., made of silver, copper, or gold), this can extremely amplify the Raman signal. This so-called surface-enhanced Raman scattering (SERS) is used, for example, in surface-enhanced Raman spectroscopy and surface-enhanced resonance Raman spectroscopy (SERRS).
In the quantum mechanical model, the Raman effect can be described as a two-photon transition between quantized energy levels. Thus, Raman control occurs when photons interact with a molecule and the molecule is placed in a virtual higher energy state. This higher energy state can result in a few different outcomes, such as the molecule relaxing to a new vibrational energy state. Thus, a photon with a different level of energy is created. In this case, the difference between the energy of the incident photon and the energy of the scattered photon is called the Raman shift. When the interaction of the molecule with light leads to a shift in the electron cloud around the molecule, this also changes its polarizability.
In plasma physics, the Raman effect describes scattering by plasma waves, in which the light amplifies the plasma wave during the scattering process and heats up the plasma (Raman instability).
In solid-state physics, spontaneous Raman processes play an important role in the determination of vibrational spectra.
In contrast to fluorescence, Raman scattering is not a resonance phenomenon, but the scattering occurs here (as in Rayleigh scattering) via virtual levels. Raman scattering consequently also occurs for photon energy levels outside of resonance to an atomic or molecular electronic transition.
Note: The most important difference between Rayleigh and Raman scattering is the elasticity of Rayleigh scattering - whereas Raman scattering is inelastic. In (elastic) Rayleigh scattering, the kinetic energy of the random particles of the system in which the scattering occurs remains the same. Consequently, the frequency of the incident light coincides with that of the scattered light. On the other hand, when (inelastic) Raman scattering occurs, the kinetic energy of the random particles changes. Consequently, the incident light has a different frequency than the light scattered by Raman scattering.
Applications:
- Raman spectroscopy measures material properties such as crystallinity, crystal orientation, composition, strain, temperature, doping, etc. In this process, the matter to be examined is exposed to (laser) light from monochromatic excitation sources with longer wavelengths. In the spectrum of the light scattered by the sample, in addition to the irradiated frequency (Rayleigh scattering), other frequencies are observed that allow conclusions to be drawn about changes in the polarizability of the molecular bonds of the sample. Using Raman spectroscopy, the vibrational signature of a molecule can be detected down to the nanogram range to understand how the molecule is composed and how it interacts with other molecules in its environment.
- Raman scattering measurement helps in the observation of crystallization processes, polymerization reactions, hydrogenation reactions, synthesis reactions, chemical synthesis, biocatalysis, and enzymatic catalysis. It is also used to identify polymorphic forms and is applied in flow chemistry and bioprocess monitoring.
- In distributed temperature sensing (DTS), Raman scattering and its temperature dependence in optical fibers are utilized as linear sensors.
Rayleigh scattering
Where electromagnetic waves encounter small particles with very small diameters compared to the wavelength of the wave, elastic scattering effects occur, known as Rayleigh scattering. In elastic scattering, the kinetic energy of the particles is conserved within the system in which the scattering occurs. Therefore, the scattered photons have the same energy as the incident photons. Rayleigh scattering occurs, for example, when light strikes the molecules of transparent solids, liquids, or gases, such as in the Earth's atmosphere or even in optical fibers. The scattering has its origin in the polarizability of the particles of the medium through which the electromagnetic wave passes. Rayleigh scattering has no effect on the state of the medium itself. The strength of the scattering depends on the frequency, whereby electromagnetic waves with shorter wavelengths are scattered more strongly. The kinetic energy of the random particles of the system in which the scattering takes place remains the same in Rayleigh scattering, consequently the frequency of the incident light coincides with that of the scattered light.
In the above example of scattering in the Earth's atmosphere by molecular oxygen and nitrogen, a second scattering effect occurs, the Raman scattering. However, this is an inelastic scattering part, which causes a minimal shift of the wavenumber of the photon.
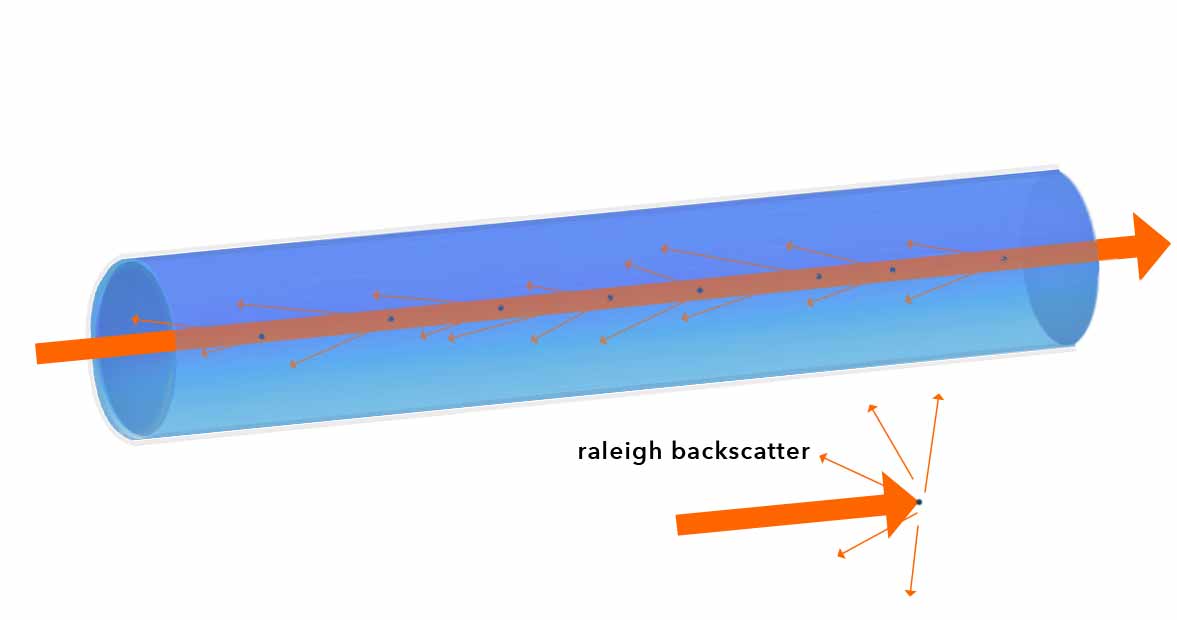
Raleigh scattering: Impurities (black) in optical waveguides lead to backscattering attenuation as the light is scattered by these molecules. The dimensions of the scattering sources are significantly below the wavelength of the light.
single photon avalanche diodes
SPAD, Geiger-mode avalanche photodiode, GmAPD
Single photon avalanche diodes (SPAD) are solid-state photodetectors and belong to the same family as photodiodes and avalanche photodiodes (APDs) but require no vacuum. While APDs show their strengths in the undistorted amplification of low-intensity optical signals, the behavior of SPADs is more closely related to the basic diode behavior. SPADS enable the direct counting of pulses and thus provide an indication of the optical intensity of the input signal, while the pulses can simultaneously trigger timing circuits to enable precise measurements of the time of arrival. These sensors are used in particular in time-of-flight 3D imaging, LIDAR technology, PET scanning, TCSPC, fluorescence lifetime microscopy and optical communication, especially in quantum key distribution. SPADs are particularly useful for single photon detection, e.g. using SPAD arrays a full FLIM image can be captured as even single photons produce a clear output signal which can be detected. SPADs have a low dead time (less than 1 ns) and consequently a high count rate, with a delay spread comparable to MCPs. A distinctive feature of SPADs is their dark noise. Since dark noise increases with area, this effect is an important criterion when increasing the light-sensitive area in SPADs.
The name Geiger-mode avalanche photodiode (GmAPD) refers to the fact that the diode is operated slightly above the breakdown threshold voltage. This leads to the fact that already a single electron-hole pair (generated by absorption of a photon or by a thermal fluctuation) can trigger a strong avalanche.
Hint: You might also be interested in HPDs.
single molecule fluorescence spectroscopy
SMD, single molecule detection, single-particle tracking, SPT, PALM microscopy, single-molecule imaging, single-molecule localization microscopy, SMLM
Single molecule fluorescence spectroscopy (SMFS) is a method of physical chemistry in which individual molecules can be made visible. Thus the dynamics and interactions in cellular systems can be examined. The technique has developed rapidly in recent years, especially in the area of high-throughput single molecule detection. In biomolecular analysis, the method enables the identification of subpopulations and the localization of molecules with sub-wavelength precision. The technology is used in biological, clinical and medical research to follow the movement of individual molecules in living cells, e.g. for ultra-sensitive and specific DNA sequencing or for the detection of diseases.
During the process, the sample is brought under a special light microscope, which is optimized for the extremely small detection volume, and then excited by means of a laser. The photons emitted during the resulting fluorescence triggered can be tracked over longer periods of times with the aid of a microscope (single-particle tracking, SPT) or may also be put underneath a time-correlating single photon measurement.
silicon photomultipliers
silicon photomultipliers (SiPM)
Silicon photomultipliers (SiPM) are single-photon sensitive semiconductor devices, more specifically arrays of hundreds to tens of thousands of integrated SPADs implemented on a common silicon substrate, each capable of individually and independently detecting photons.
All microcells are read in parallel. This makes it possible to generate signals in a dynamic range from a single photon to 1000 photons for a device with an area of only one square millimeter.
Compared to conventional PMTs, there is a low or even negligible additional noise factor. In addition, the bias voltages are 10 to 100 times lower, which simplifies the electronics. In the red to near-infrared they have a significantly higher quantum efficiency than available PMTs and a significantly larger dynamic range when a large number of SPADs are placed together. This enables faster imaging rates or a higher signal-to-noise ratio.
Please note: Unlike PMTs, SiPM may require sub-ambient cooling and may be difficult to obtain large active areas as the dark numbers per area are higher than PMTs.
Superconducting nanowire single-photon detectors
(SNSPD or SSPD)
Superconducting Nanowire Single-Photon Detectors (SNSPDs) are highly sensitive detectors that can detect single photons. They play a central role in areas such as quantum optics, quantum communication, astronomy, and quantum sensing. Functioning relies on superconducting materials operated at cryogenic temperatures to enable extremely high detection efficiency and low dark count rates.
Superconducting nanowire single photon detectors are based on the principle of superconducting detection. A superconducting material conducts electric current without any resistance when cooled below a critical temperature called the transition temperature.
When a photon hits such a detector, it is absorbed, causing a pair of electrons called a Cooper pair to form. The formation of the Cooper pair causes a decrease in the electrical resistance of the superconducting material, which is registered as a signal.
In an SNSPD, photons generate a voltage pulse when they hit the nanowire. This is a thin (≈ 5 nm) and narrow (≈ 100 nm) superconducting nanowire, typically hundreds of micrometers long. The nanowire is arranged in a compact meander geometry to create a square or circular pixel with high detection efficiency. The nanowire is fed with a DC that is slightly below its critical superconducting current. When a photon hits the wire, it breaks Cooper pairs and thus reduces the local critical current below the value of the feed current. This leads to the formation of a hot spot with finite electrical resistance, which is usually greater than the impedance of the readout amplifier and can thus be measured as a voltage pulse.
This weak voltage pulse is amplified by a low-noise amplifier to make it usable for further processing. The digitization of the amplified pulse is usually done with an analog-to-digital converter (ADC) so that the data can be analyzed with high precision. The digitized signals are processed in real-time to extract the arrival time and other properties of the photons.
Superconducting nanowire single photon detectors offer high sensitivity and high temporal resolution with very high count rates, very short dead times, and very low temporal jitter compared to other single-photon detectors. They can detect single photons at very low intensity, making them ideal for quantum communications, quantum cryptography and quantum computing. Because they are based on superconducting technology, they also have a very low background rate, which means they are very accurate and do not cause false alarms.
However, using superconducting nanowire single photon detectors also has disadvantages. One of the biggest drawbacks is that they usually need to be cooled to very low temperatures, usually below 4 Kelvin (-269°C). This requires special cooling equipment, which can be expensive and impractical. In addition, they have a limited detection area and are therefore not suitable for covering large areas.
Applications
- In quantum communication, SNSPDs enable the lossless detection of single photons, which are used, for example, to transmit quantum bits (qubits) in quantum cryptography systems.
- In astronomy, SNSPDs are used to detect extremely weak light signals from distant celestial objects.
- In biophotonics, SNSPDs are used to measure fluorescence signals in biological samples with high temporal precision.
Advantages of SNSPDs:
- High efficiency: SNSPDs provide detection efficiencies of up to 98%.
- Their time resolutions are in the range of a few picoseconds.
- Their low dark count rate reduces the probability of false measurements.
Disadvantages:
- SNSPDs require sophisticated cryogenic cooling.
- This makes their operation quite costly.
- Since it is difficult to arrange SNSPDs in large arrays, corresponding detectors have only limited scalability.
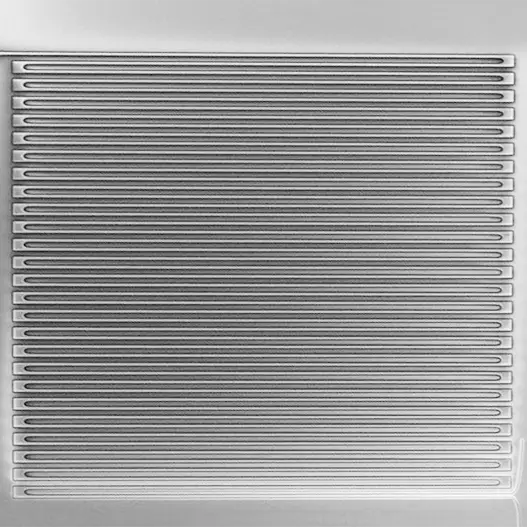
Scanning electron micrograph of a typical superconducting nanowire single-photon detector (SNSPD). The width of such a meandering nanowire detector is usually in the lower micrometer range.
Single Photon LIDAR
(SPL)
Single photon LIDAR offers particularly fast data acquisition and a particularly high data density, because this technique detects multiple laser pulses simultaneously and analyzes them separately. Instead of detecting the entire light signal, individual photons are detected. The Single Photon Lidar (SPL) technique uses collimated laser radiation in the visible green region of the spectrum (λ=532 nm). The collimation of the laser pulse is achieved by using a diffractive optical element (DOE) to split the laser into several partial beams, called "beamlets". In this way, the density of the measurement points is significantly increased. In contrast to GmLidar, not the entire FOW of the receiver is illuminated in full, but each beamlet is aligned in its spatial direction in such a way that it hits a single-photon-sensitive detector array assigned to it on the detector side, the so-called "sub-array". Each individual sub-array consists of numerous light-sensitive detector elements and virtually splits the FOW into sub-areas that can be included in the analysis in parallel. In this way, the light-sensitive sub-arrays are efficiently illuminated and optical crosstalk is avoided. Provided that the dynamic range is properly adjusted, the strength of the output signal from the sub-arrays is linear with respect to the optical power. In this way, each laser beamlet can deliver multiple echoes, the analysis of which also makes it possible to pass through vegetation, for example. Compared to conventional LIDAR, SPL provides higher area performance at comparable point cloud densities, although the height accuracy for non-planar surfaces is somewhat lower than with full-waveform LIDAR. Single-photon LIDAR is more sensitive to multiple reflections than Geiger-mode LIDAR. As it currently stands, SPL does not achieve the precision of full-waveform LIDAR.
The wavelength used in SPL makes it possible to perform bathymetric measurements and combine them with topographic surveys.
A typical use case for SPL would be the detection of objects under foliage in a forest from above. In this case, individual beamlets might detect treetops, others might hit and be reflected by some branches along the way, and other beamlets might hit the ground and provide corresponding data.
TCSPC
Time Correlated Single Photon Counting, time domain FLIM, tdFLIM
In Time-correlated single-photon counting (TCSPC) fluorescence decays are measured over the time axis. The method is an essential part of fluorescence lifetime imaging microscopy (FLIM). Time-Correlated Single Photon Counting is considered a particularly gentle measurement technique because the light pulses required for sample excitation have low pulse energy. This is possible because only a single photon is processed at a time. TCSPC is based on the detection of these individual photons and the measurement of their arrival times in relation to a reference signal, which is usually the time of emission of the laser pulse that was used to excite the sample. This laser pulse occurs with a high repetition rate so that a sufficiently high number of individual photons can be determined for the resulting measurement of the fluorescence lifetime.
TiGer
Timing Generator
Most of our ADC and TDC products are equipped with this feature which is a great help to control your experimental setup. The TiGer can be used to output periodic Timing patterns, delayed copies of other signals, or random triggers among other use cases.
trigger matrix
trigger blocks, mapping
In most cronologic products, any digital input can be used to trigger any triggerable circuit. The mapping is performed by the configurable trigger matrix. Inputs can be input connectors, TiGer pattern generators, software triggers, and others. Triggerable circuits can be input gates, TiGer pattern generators, auxiliary ADC measurements among others.
transient recorder
digitizer
Transient recorders are oscilloscopes that are designed to measure waveforms with very high bandwidth. Unlike equivalent time sampling scopes a transient recorder acquires the measurement in a single shot. The signal does not need to be repetitive. For digital data acquisition products, the terms ADC, digitizer, and transient recorder are mostly used interchangeably.
TOF-MS
TOF- & MASS- spectroscopy / spectrometry detectors, TOFMS, ion-counting, ionization spectroscopy
In time-of-flight mass spectrometers ions are accelerated in an electric field. The time it takes for the ion to reach a detector is used to determine the mass-to-charge ratio of the ion. With a constant-fraction-discriminator (CFD) and time-to-digital converters, the flight time of the ion can be easily be measured with high precision. In setups where a high number of ions of the same mass is created, an ADC digitizer can be used instead to also obtain information on the pulse height and thus on the number of ions in each measured pulse. Modern TOF systems achieve mass accuracies of less than 1 ppm.
Read more about TOF-MS in this article.
vector network analyzer
VNA
A vector network analyzer (VNA) is a type of test instrument used to measure important network parameters of RF and microwave components and networks.
A VNA usually consists of one or more signal generators, e.g., one for transmission measurement (or "forward measurement") and one for reflection measurement (or "backward measurement"), and one or more receivers that detect the amplitude and phase of the signals. Two built-in signal sources are of interest for amplifier intermodulation tests, for example, where two different frequencies are required for the test. For other measurements, one source can also provide the RF signal and the other the LO signal.
All VNAs apply a known stimulus signal to the device under test (DUT) and measure the response. By measuring the DUT's response at different frequencies and comparing it to the known stimulus, the VNA can determine the DUT's amplitude and phase characteristics, such as its gain, return loss, and transmission/reflection coefficients. This information can be used for the design, optimization, and troubleshooting of RF and microwave circuits and systems.
In a vector network analyzer, the DUT, such as an assembly or electrical gate, is measured over frequency rather than over time as in a conventional TDR.
For example, the assembly being measured can be fed a series of sine waves so that the signal changes that occur can be detected by the receiver in the network analyzer. This is done by determining the vector ratio between the incident and reflected voltages, sweeping the frequency of the sinusoidal waveform to determine the response of the device under test as a function of frequency. Thus, it is a relative measurement of transmitted and received signals. In particular, VNAs can also capture amplitude and phase as complex quantities and thus express scattering parameters (S-parameters) in complex-valued terms.
The acquired reflection and transmission data are presented by means of displays in such a way that the information can be interpreted in a user-friendly manner. Many RF network analyzers, therefore, offer features such as linear and logarithmic formats, sweeps, polar plots, Smith charts, etc. Trace markers, limit lines and pass/fail criteria can also be added.
Since VNAs have a wider dynamic range compared to TDR oscilloscopes, they can be used for more accurate measurements. In VNA-based time domain analysis, temporal signals are decomposed into their frequency components so that the signal can be reconstructed from the sum of these frequency components. Data measurements with VNAs are considered very stable, accurate, and versatile.
Wien Filter
velocity filter
A Wien filter, also known as a velocity filter, is used to separate ions according to their velocity and thus indirectly according to their mass-to-charge ratio (m/z). This separation is based on the simultaneous application of an electric and a magnetic field, which are arranged orthogonally to each other. A Wien velocity filter consists of a homogeneous electric field and a homogeneous magnetic field that are perpendicular to each other. The ions enter perpendicular to both fields and only those ions that have the appropriate velocity pass through the velocity filter. The forces of the electric and magnetic fields are equal, slower or faster ions are deflected and moved out of the way. As the speed of the ions depends on their mass-to-charge ratio, the Wien filter can be used as a mass selection tool. Ions with different m/z values have different velocities and are therefore deflected to different degrees.
In TOF-SIMS, the separation of ion masses is mainly realized by their time of flight, which is why Wien filters are only used here in certain cases. In such special applications, a Wien filter could be used to preselect the ions or to improve mass selection, especially when using pulsed ion sources or when combining TOF-SIMS with other analytical methods.
This is because with a complex sample shape, the emission angle of the secondary ions is strongly influenced by the electric field. These uncertainties occur due to differences in the initial energy and emission angle, even if the ions in question have the same mass. Therefore, in some ToF measurement systems, the time-of-flight differences of the emitted secondary ions are compensated by Wien filters. The goal of such measures is to improve the mass resolution and, if necessary, to achieve better delineated imaging.
zero suppression
All of our ADCs feature onboard zero suppression. The idea of this feature is, that only data that meet specifications predefined by the user are transmitted. This reduces PCIe busload in order to make maximum use of the available readout bandwidth. When set up correctly, only relevant pulses (above a certain threshold level) are detected, so that the amount of data that needs to be copied and analyzed is reduced drastically.